2 Good Reasons to Buy the SGD/JPY Pullback
Talking Points:
Identifying Key Support Levels for SGD/JPY
Elliott Patterns at Work on Two Time Frames
Step-by-Step Parameters for Taking This Trade
Friday’s poor US non-farm payrolls (NFP) data has helped stimulate a number of trade set-ups across the FX markets. In this case, we’re looking to trade the Singapore dollar (SGD) against the Japanese yen (JPY), as SGD/JPY has been pulling back since the start of 2014. This trade is based on both Elliott Wave and Fibonacci analysis in the pair.
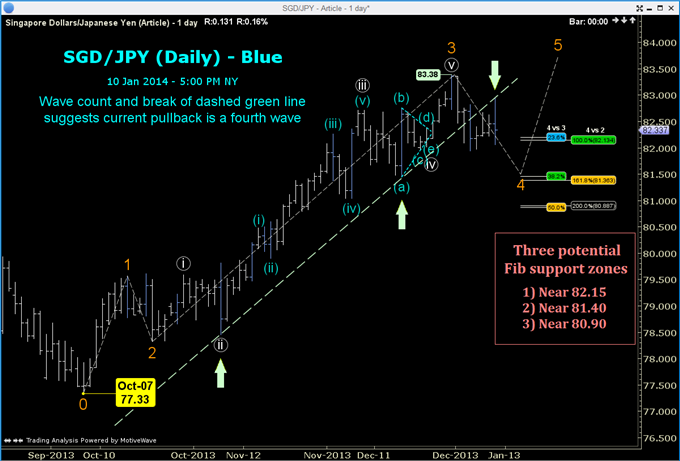
The daily chart below shows price action starting at the early-October low of 77.73. The uptrend is supported by a green dashed line, though it only has two points of support instead of our preferred minimum of three.
Since the high at 83.38, price has pushed below the uptrend line, and the next attempt to move higher found resistance at that same uptrend line. SGDJPY has since started moving lower following Friday’s poor NFP data.
Guest Commentary: 3 Possible Support Zones for SGD/JPY
The Elliott wave count on the daily chart shows three orange waves higher up to 83.38. It’s often useful to conduct a Fibonacci analysis of both the second and third waves to determine possible zones of support for the end of the fourth wave. Three pairs of lines are shown, suggesting that potential Fibonacci support zones might occur 1) near 82.15; 2) near 81.40; or 3) near 80.90. Since price has already moved below 82.15, we’ll dismiss this level and focus only on the latter two.
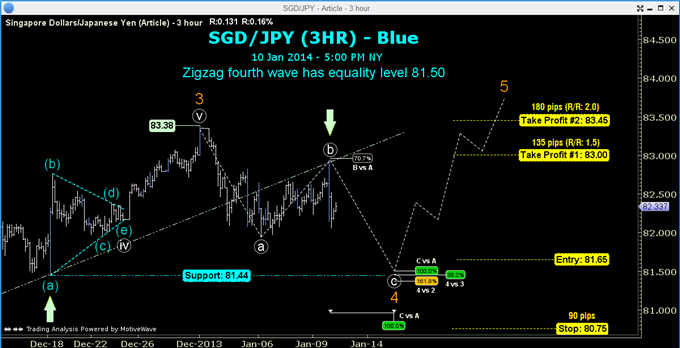
The three-hour chart of SGDJPY (see below) shows price action from the middle of December. The fourth wave prior to the 83.38 high is shown as a triangle whose low is 81.44. The correction from 83.38 has two completed legs (marked ‘a’ and ‘b’). The shape of this correction suggests a possible zigzag whose equality level (i.e. the level where the c-wave is the same length as the a-wave) is 81.50.
This equality level is important because:
81.50 is close to one of the two possible support levels from the daily chart (i.e. near 81.40); and…
81.50 is close to 81.44, the low of the prior degree’s fourth wave, which is a typical support level for such waves.
Guest Commentary: Zigzag Pattern on Shorter-Term SGD/JPY Chart
We now have multiple reasons across two time frames to expect a support of the fourth wave near 81.50, which forms the basis for today’s trade. Therefore, we’ll look to buy SGDJPY just above this potential support level at 81.65, also allowing for the SGDJPY spread. We’ll place our stop at 80.75, which is below the other potential support level of 80.90 from the daily chart, producing a 90-pip stop. We’ll generate two targets from this trade, one on either side of the existing 80.38 high.
To make the trade “worthwhile” from a risk/reward perspective, we’d need to achieve a target at least 50% larger than the size of our stop (i.e. at least 135 pips). The first take-profit position will be 83.00, which is exactly 135 pips above the entry (i.e. risk $1 to make $1.50). Our second exit is 83.45 (180 pips beyond entry), which risks $1 to make $2. The 83.45 level is only seven pips above the existing high, so again, we’ve set conservative targets, but both provide a healthy risk/reward ratio.
In the past, we’ve discussed the option to set the stop where the Elliott wave count is “wrong.” In this case, the stop would be placed near 79.50, over 200 pips away from our entry. Neither “take-profit” target is 200 pips from our entry, so for this set-up, the problem with using a more conservative stop is that it impacts too severely the risk/reward ratio.
Long Set-up for SGD/JPY
Trade: Buy SGDJPY at (or near) 81.65
Stop Loss: Place stop at 80.75
Take Profit: Two take profit positions: 83.00 and 83.45
Trade Management: If price reaches 83.00, move stop to breakeven
By Todd Gordon, founder, TradingAnalysis.com
Receive three free months of premium trade signals and analysis by visiting TradingAnalysis.com.
Disclaimer: Trading foreign exchange on margin carries a high level of risk and may not be suitable for all investors.
DailyFX provides forex news and technical analysis on the trends that influence the global currency markets.
Learn forex trading with a free practice account and trading charts from FXCM.


