
Here's where Americans are moving to and from

Flickr / TheMuuj
The Census Bureau recently released estimates of how US counties' populations changed between 2016 and 2017.
The estimates include data on what counties attracted the most domestic migration, or Americans moving from one place to another within the country.
Americans move around a lot.
The US Census Bureau recently released estimates on population change for each of the 3,142 counties and county-equivalents in the country. In addition to overall population change, the bureau also included data on the components of that change, including net domestic migration, or the difference between how many people moved into a county from elsewhere in the US and how many moved out to another part of the country.
Some of the big winners include suburban counties surrounding big southern metro areas, like Atlanta, Dallas, and Houston. Oil- and gas-heavy areas in North Dakota, Texas, and Oklahoma saw relatively large portions of their populations moving away.
Here's the estimated net domestic migration per capita for each county between July 1, 2016 and July 1, 2017:
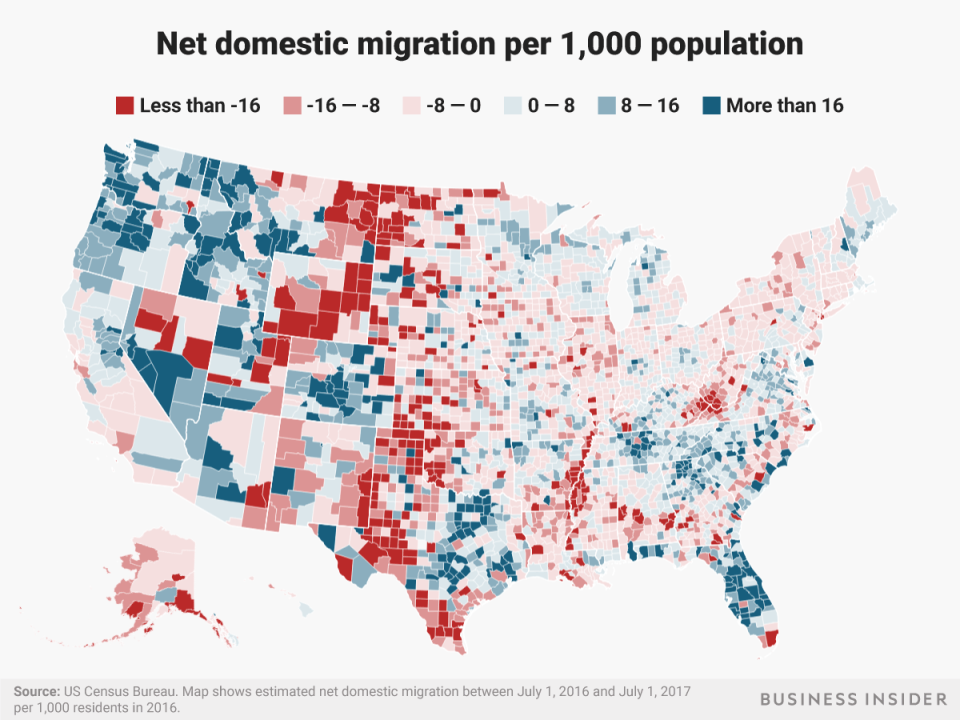
Business Insider/Andy Kiersz, data from US Census Bureau
Here are the 10 counties with the highest per-capita net domestic in-migration, among counties with populations of over 10,000 in both 2016 and 2017. Five of the top 10 counties were in Texas:

Business Insider/Andy Kiersz, data from US Census Bureau
And here are the 10 counties that lost the most per capita from domestic migration:

Business Insider/Andy Kiersz, data from US Census Bureau
NOW WATCH: Wall Street's biggest bull explains why trade war fears are way overblown
See Also:
