AUD/USD Technical Analysis 02.06.2013
AUD/USD Technical Analysis- Prices turned lower as expected after putting in a bearish Dark Cloud Cover candlestick pattern below multi-month range resistance in the 1.0578-1.0624 area. Sellers have now pushed through rising trend line support set from late October and are testing below the December 26 low at 1.0344. A confirmed break below that exposes the November 16 bottom at 1.0286. The trend line, now at 1.0403, has been recast as resistance.
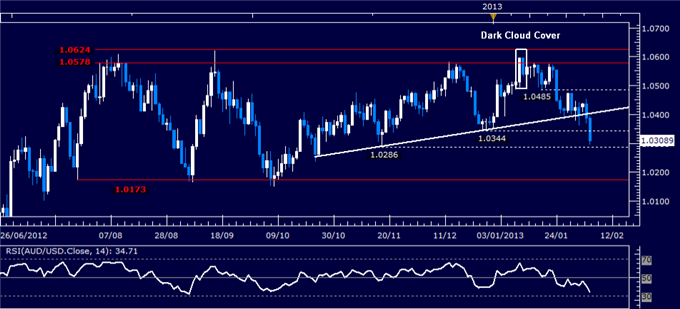
Daily Chart - Created Using FXCM Marketscope 2.0
--- Written by Ilya Spivak, Currency Strategist for Dailyfx.com
To contact Ilya, e-mail ispivak@dailyfx.com. Follow Ilya on Twitter at @IlyaSpivak
To be added to Ilya's e-mail distribution list, please CLICK HERE
New to FX? Watch this Video. For live market updates, visit the Real Time News Feed
DailyFX provides forex news and technical analysis on the trends that influence the global currency markets.
Learn forex trading with a free practice account and trading charts from FXCM.
