
Chart Pattern Predicts a Big Sell-off in This Stock in the Next 6 Weeks
After staging a massive rally off its 2011 lows, toymaker Hasbro (HAS) came very close to re-testing its 2010 all-time highs on May 22, the day of the "Bernanke top" in the S&P 500.
The stock has corrected along with the broader market, and over the past few weeks has developed a bearish formation known as a bear flag on its daily chart. Should the stock fall out of this formation, the downside move could accelerate.
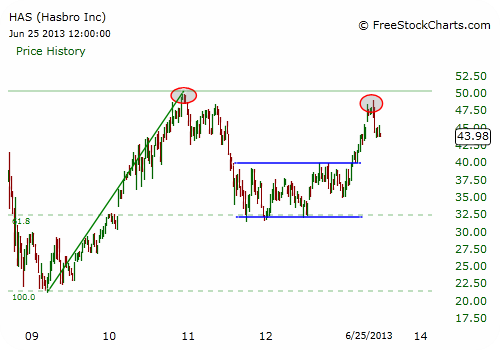
Selling toys may seem as easy as taking candy from a baby, but toymakers are exposed to the swings of the global economic cycle, as we can see on the chart below. From the time the central bank rescue packages began to lift stocks in 2009 to the December 2010 top, HAS rallied more than 135%. But by September 2011, 60% of that move had evaporated. Volatile enough for you?
After this nasty retracement, HAS took its time, as it should have, to regroup and develop a higher low versus the 2009 low. The stock based from October 2011 until February 2013, at which point it broke past an important resistance line, which I will discuss on the daily chart in a moment.
The basing process took place in 5-point ranges, and by so doing, was ultimately coiling up for a powerful move in either direction. HAS broke past resistance in early 2013, spurred by general enthusiasm in stocks, and then developed a marginally lower high in late May versus the 2010 highs.
Thus, from a longer-term point of view, Hasbro stock offers investors a clear reference level at $49, just above the May highs.
Moving on to the daily chart below, we can see that the toymaker fully participated in the 2013 equity melt-up, right up to the last minute.
Ready to fire out of the gate in January, HAS surged a cool 36% in more or less a straight line until topping out on May 22. After correcting a quick 10% to let out some of the steam, it settled into a somewhat uncharacteristically tight consolidation pattern, which it has been in throughout the month of June.
From a technical point of view, this consolidation formation following an initial sell-off can be classified as a bear flag. The flag pole of the formation is measured by calculating the difference between the swing high and the swing low.
In the case of HAS, the difference between the May 22 high at $48.97 and the June 6 low at $43.46 is about 5.5 points. We then take this number and subtract it from the lows of the swing to arrive at a potential price target near $38.

Recommended Trade Setup:
-- Buy HAS on a daily close below $43.80, and thus a break out of the bear flag formation
-- Set stop-loss at $45
-- Set initial price target at $40 for a potential 9% gain in 3-6 weeks
-- Set secondary price target at $38 for a potential 13% gain in 3-6 weeks
Related Articles
Bold Analyst Call Says This Sector is an 'Immediate Buy'
Fallen Blue Chip Could Stage a Double-Digit Rally This Year
Discount Retailer Offering Income Traders a Chance to Make 24% a Year
