Checking In On iShares' IEMG
I wrote about the iShares Core MSCI Emerging Markets ETF (IEMG) a few days before it launched, calling it the “new and improved EEM,” but noting a few caveats.
Now that the fund has actually launched and has a few weeks of trading history under its belt, I’d like to revisit those caveats to determine whether IEMG is truly a better version of the long-standing iShares MSCI Emerging Markets Index Fund (EEM).
One of the exciting things about IEMG is its broad coverage of 99 percent of investable emerging markets companies, compared with EEM’s 85 percent coverage.
The problem with that, however, is that expanding that coverage is expensive, so concessions have to be made.
To keep costs down and spreads tight, iShares has heavily optimized the MSCI Emerging Markets Investable Market Index, which holds close to 2,600 companies. IEMG, in contrast, holds about 1,600.
A big part of this optimization strategy is to use iShares ETFs to access certain emerging markets. IEMG’s top holding is currently the iShares MSCI India Index Fund (NYSEArca:INDA), at over 6 percent. IEMG also holds the iShares MSCI Chile Investable Markets Index Funds (ECH) and the iShares MSCI India Small Cap Index Fund (NYSEArca:SMIN), which together make up an additional 3 percent of the fund.
Together, those three ETFs add about 235 companies to IEMG’s portfolio, so there’s still a fair amount of optimization happening at the individual company level.
The question isn’t really whether it optimizes, though; it’s what the effect of the optimization has on IEMG’s bottom line.
The graph below shows the total return net asset value performance of IEMG since its Oct. 18, 2012 inception date, compared with that of its underlying index, the MSCI Emerging Markets IMI, along with EEM and EEM’s index, the MSCI Emerging Markets Index.
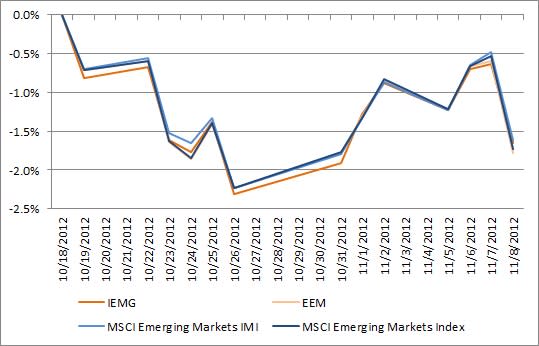
For the most part, the two ETFs—and their underlying indexes—have performed pretty similarly in the very limited time that IEMG has been on the market. That said, there are stretches where IEMG has lagged its index by as much as 11 basis points in a day, and underperformed both EEM and EEM’s index as well.
It’s impossible to infer what long-term tracking will look like from two weeks of data, so the jury’s still out on the IEMG vs. EEM question.
Lengthening the time period will also allow the 49 basis point expense ratio differential between the two—0.18 percent for IEMG and 0.67 percent for EEM—to have an impact.
Still, I’m not convinced that it’s time to switch over from EEM into IEMG yet, especially given all the trading costs involved in doing so.
As Ugo pointed out in his blog on trading expenses, IEMG has a very high creation fee, especially compared with EEM—it costs about 0.91 percent to create one creation unit versus EEM’s 0.04 percent.
While that high creation fee can be spread out among multiple creation units, IEMG doesn’t yet have the interest to support the putting together of multiple creation units at one time. In fact, when IEMG was seeded, market makers had to band together to create 17 creation units worth of shares at once to bring costs down to a more reasonable 0.05 percent.
Even if you’re not creating shares or trading with market makers, that cost gets passed through in the form of premiums and, to an extent, wider bid/ask spreads. IEMG is currently trading at a 12 basis point spread—six times wider than EEM’s 2 basis points.
Overall, tracking slippage and trading costs are likely to be better indicators of IEMG’s true costs than its headline expense ratio.
All this means that only time will tell whether IEMG is truly the cheaper option.
At the time this article was written, the author held no positions in the securities mentioned. Contact Carolyn Hill at chill@indexuniverse.com.
Permalink | ' Copyright 2012 IndexUniverse LLC. All rights reserved
More From IndexUniverse.com
