Crude Oil Futures Fluttering In Between Butterflies
CLK14 is in between opposing harmonic patterns, in this case both patterns are Butterflies. This is a visual of a very large range that has no commitment for either direction until price holds above 110.32 or below 90.48. Taking out one of these levels will invalidate one of the patterns and increase probability of playing out the other.
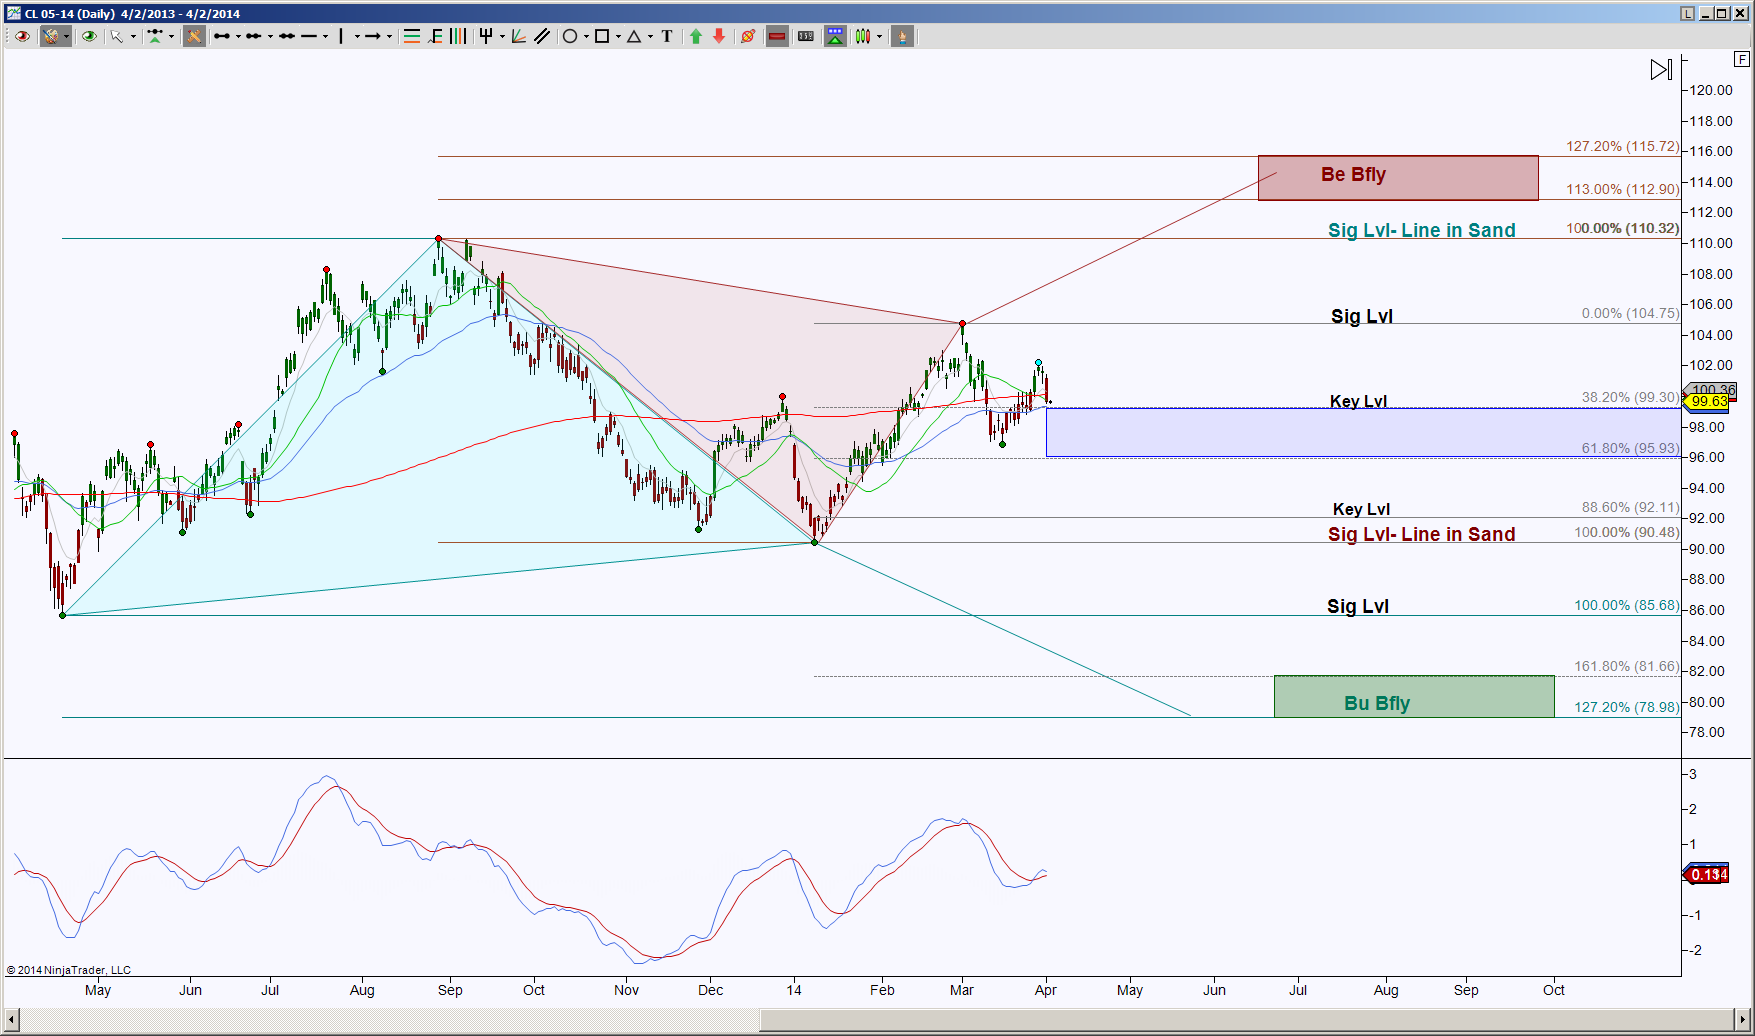
The day chart shows that the initial levels to break and hold are either 104.75 or 99.30 and that there is currently some divergence in whether the nearby 99.30 can hold or not. There are patterns within patterns but for simplicity purposes I’ve left those off this chart, the great thing about patterns within patterns is they help the larger patterns play out.

For an intraday perspective, I decided to capture that impulsive move from 104.75 to 96.90. I’m using the STRenko 33 bar size to see what harmonic patterns are occurring within that rotation. One reason for the stall at 99.30 is there is a completion of a Bullish Bat harmonic pattern, this correlates with this chart’s 200 MA. If this is a valid reversal pattern, then the ideal MINIMUM bounce target is 100.41, this is still a shallow retracement but still a respectable retracement. IF price can get to that 100.41, what happens then offers an extremely huge amount of information. So let’s talk out two scenarios,a retracement mode means price will hold above 99.39, which in turn holds above that daily GRZ and has a long opportunity to 100.41, a hold above there has an ideal target at 102.24, this would be a 100% retracement which is awesome. A hold above 102.24 has the ideal target of yet another Butterfly at the red zone at 105.77 to 106.89, this helps price test that daily significant level of 104.75. The opposite scenario is price cannot push above 100.41 or better yet doesn’t bounce at all, just stalls a bit then breaks down 99.39, it doesn’t have far to go for the initial target of 98.60, but failure to hold there has an ideal target of 97.03. This helps retest a double bottom region and it correlates with the midpoint of the daily GRZ. If price breaks below there the extension targets are 9542 and 93.57, note these levels help price get below the daily GRZ level 95.93. When prepared for multiple scenarios, it doesn’t really matter which direction it goes, but the level price is currently testing is an important one, so note if it can find buyers here and how far can they take it or if the sellers are drawn to that 97.03 region on the intraday target and 95.93 on the daily target.
