Dollar Waits for Downside Follow-Through, S&P 500 at Risk
THE TAKEAWAY: The US Dollar continues to wait for follow-through on a bearish chart setup below the 2012 yearly while the S&P 500 appears vulnerable to a pullback.
US DOLLAR TECHNICAL ANALYSIS– Prices put in a bearish Dark Cloud Cover candlestick pattern below resistance in the 10323-26 area, marked by the 123.6% Fibonacci expansion and the 2012 yearly high. The setup hints a move lower is ahead, with negative RSI divergence reinforcing the case for a downside scenario. Near-term support is at 10248, the 100% Fib, with a break below that exposing rising channel resistance-turned-support at 10226.
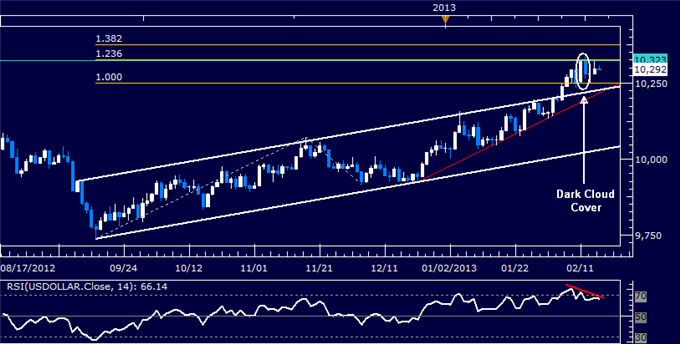
Daily Chart - Created Using FXCM Marketscope 2.0
S&P 500 TECHNICAL ANALYSIS – Prices put in a Hanging Man candlestick below resistance at 1523.00, the 123.6% Fibonacci expansion, warning of indecision and hinting a reversal lower may be ahead. Negative RSI divergence reinforces the case for a downside scenario. A break below initial rising trend line support (now at 1516.20) exposes the 100% Fib at 1497.50. Alternatively, a push through resistance aims for the 138.2% mark at 1538.70 (now shown).
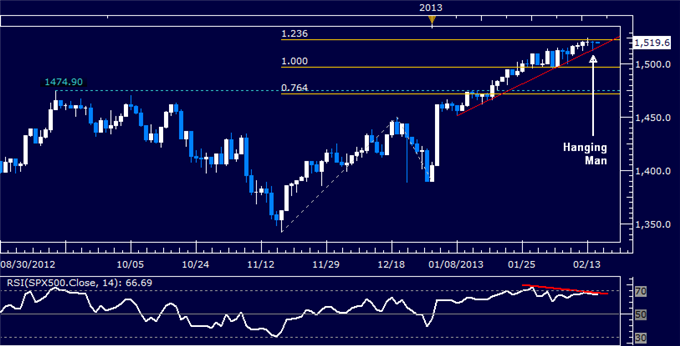
Daily Chart - Created Using FXCM Marketscope 2.0
GOLD TECHNICAL ANALYSIS – Prices broke critical rising trend line support set from mid-May 2012 and took out the 38.2% Fibonacci expansion (1648.20). Sellers are now testing the 50% mark at 1633.06, with a push beneath that aiming for the 61.8% Fib at 1617.93. The 1648.20 level has been recast as near-term resistance. A reversal back above that eyes the trend line (now at 1662.01) anew.

Daily Chart - Created Using FXCM Marketscope 2.0
CRUDE OIL TECHNICAL ANALYSIS– Prices rebounded from support at 95.14, the 23.6% Fibonacci retracement, to challenge resistance is in the 98.02-21 area (marked by the 23.6% Fib expansion and the January 30 high). A break above that exposes the 38.2% expansion at 99.91. Alternatively, a reversal below 95.14 initially targets the 38.2% retracement at 93.24.
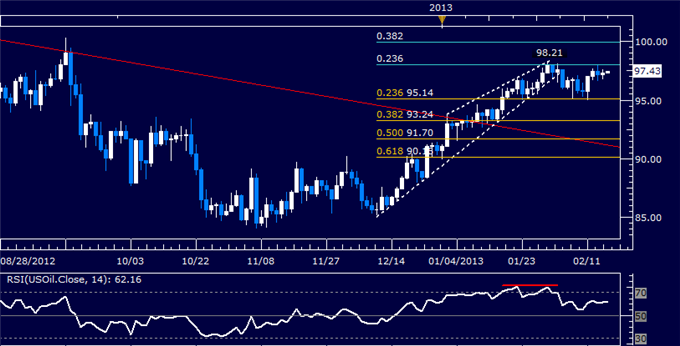
Daily Chart - Created Using FXCM Marketscope 2.0
--- Written by Ilya Spivak, Currency Strategist for Dailyfx.com
To contact Ilya, e-mail ispivak@dailyfx.com. Follow Ilya on Twitter at @IlyaSpivak
To be added to Ilya's e-mail distribution list, please CLICK HERE
DailyFX provides forex news and technical analysis on the trends that influence the global currency markets.
Learn forex trading with a free practice account and trading charts from FXCM.
