Flailing Financials: Charts for Bank ETFs Look Ugly
Several sectors have impressed this year, delivering double-digit returns along the way. Financial services, the second-largest sector weight in the S&P 500, is not one of those groups.
The Financial Select Sector SPDR (XLF) , the largest U.S. sector ETF, entered Thursday with a 5.2% year-to-date gain. That is a middling performance among the nine sector SPDRs with only the Consumer Staples Select Sector SPDR (XLP) , Industrial Select Sector SPDR (XLI) and the Consumer Discretionary Select Sector SPDR (XLY) being worse performers.
And like their industrial counterparts, ETFs such as XLF and the Vanguard Financials ETF (VFH) are displaying some unattractive technical signs. [Industrial ETFs Look Flimsy]
“The number of Financial Sector stocks that are above their respective 50-EMA has been dropping over the last couple of weeks, creating a negative divergence with price. This is a sign that each time $XLF has hit $23, fewer stocks in this sector have been able to stay above their intermediate-term Moving Average. Based on these two breadth indicators, it does not appear things look overly bullish based on the internals of the Financial Sector,” according market technician Andrew Thrasher.
In another less-than-encouraging sign for bank ETFs, it is clear momentum for the financial services sector, already hard to come by, is waning. Thrasher notes that since June, XLF’s relative strength “indicator has been making a series of lower highs as it creates a negative divergence. Even though price has been rising/consolidating, momentum has been weakening.”
Entering Thursday, XLF was flat for July while VFH was lower by half a percent. Both ETFs are lower by almost 1.3% today. VFH now resides below its 50-day simple moving average.
At the fundamental, financial services stocks and ETFs are contending with issues such as increased regulatory costs and a summer swoon in trading revenue.
Between the end of 2013 and the end of 2007, regulatory costs increased by over 100%, or $35.5 billion, to $70.2 billion for Bank of America (BAC), Citigroup (NYSE: C), Goldman Sachs (GS), JP Morgan Chase (JPM), Morgan Stanley (MS) and Wells Fargo (WFC), reports Saabira Chaudhuri for the Wall Street Journal. The costs are specific to these banks, along with others with assets over $50 billion, due to their size and perceived risk. [Regulatory Burdens Hinder Bank ETFs]
In a move that is nothing short of impressive, the iShares US Broker-Dealers ETF (IAI) entered Thursday with a July gain of nearly 3%. That despite a spate of updates from Wall Street banks that said trading revenue slid in the second quarter. Conventional wisdom says if things were boring on Wall Street in May or June, July and August could be even slower. [Summer Blues for Broker-Dealers ETFs]
Financial Select Sector SPDR
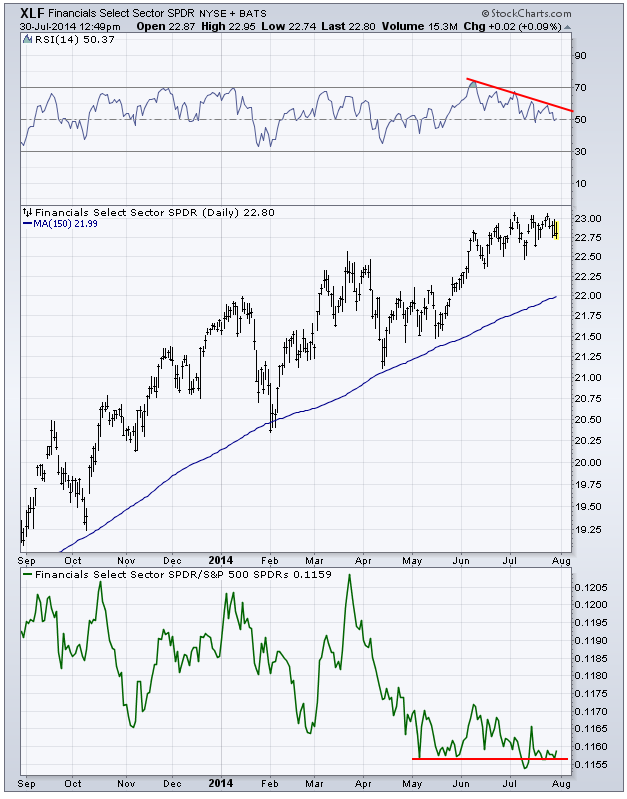
Chart Courtesy: Andrew Thrasher, CMT
