Forex Analysis: US Dollar Breaks Resistance as S&P 500 Rally Fizzles
THE TAKEAWAY:The US Dollar continued to grind through layers of technical resistance as an upside surge in the S&P 500 failed to produce meaningful follow-through.
US DOLLAR TECHNICAL ANALYSIS– Prices are pulling back to retest resistance-turned-support at 9963, the 38.2% Fibonacci retracement. A break below this boundary exposes the 9874, a level marked by the intersection of a rising channel bottom set from mid-September and a falling channel top established from the June 1 high. Channel resistance is at 9998, with a break above that aiming for the 50% Fib at 10032.

Daily Chart - Created Using FXCM Marketscope 2.0
S&P 500 TECHNICAL ANALYSIS – Prices failed to hold up after a break above the 1424.90-1425.10 area, reversing back downward toward the 1400 figure. This barrier is reinforced by the 38.2% Fibonacci retracement at 1394.30. A drop below the latter level targets the 50% retracement at 1369.40. Alternatively, a push back above the 1424.90-1425.10 region aims for rising channel support-turned-resistance at 1448.40.
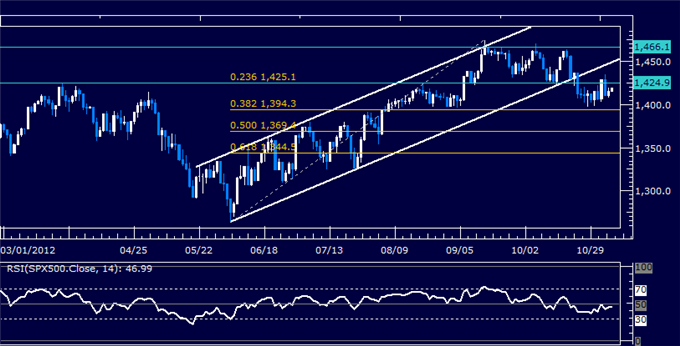
Daily Chart - Created Using FXCM Marketscope 2.0
GOLD TECHNICAL ANALYSIS – Prices took out support at 1693.06, the 38.2% Fibonacci retracement, exposing the 50% level at 1661.32 as the next downside objective. A further push below that targets the 61.8% Fib at 1629.58. The 1693.06 level has been recast as near-term resistance. A break back above that eyes the 1732.33-35.65 area anew.
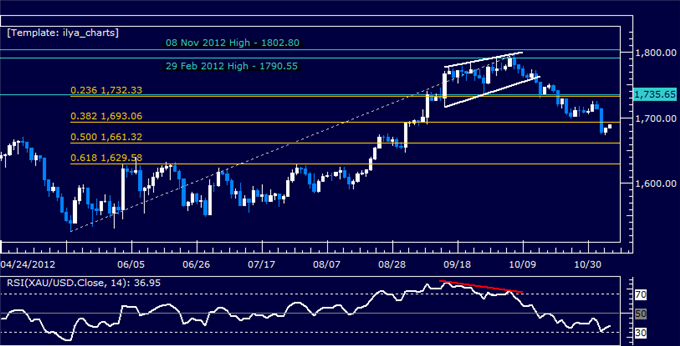
Daily Chart - Created Using FXCM Marketscope 2.0
Want to learn more about RSI? Watch this Video.
CRUDE OIL TECHNICAL ANALYSIS– Prices continue to stall above the 50%Fibonacci expansion at 83.76. Initial resistance lines up at 87.66, the 38.2% Fib, with a break above that targeting a falling trend line set from late September (now at 91.12). Alternatively, a break below 83.76 targets the 80.00 figure and 61.8% level at 79.84.
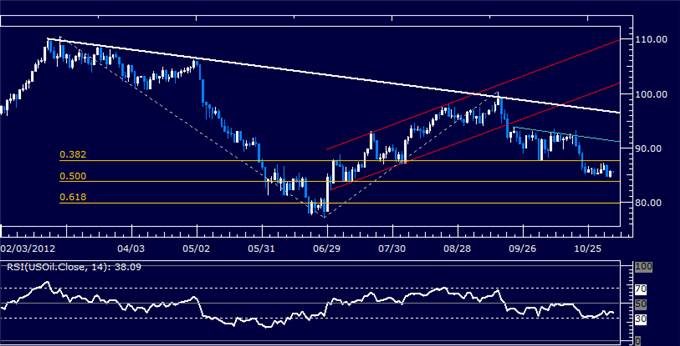
Daily Chart - Created Using FXCM Marketscope 2.0
--- Written by Ilya Spivak, Currency Strategist for Dailyfx.com
To contact Ilya, e-mail ispivak@dailyfx.com. Follow Ilya on Twitter at @IlyaSpivak
To be added to Ilya's e-mail distribution list, please CLICK HERE
DailyFX provides forex news and technical analysis on the trends that influence the global currency markets.
Learn forex trading with a free practice account and trading charts from FXCM.
