Forex: GBP/USD Technical Analysis – Double Top in the Works?
To receive Ilya's analysis directly via email, please SIGN UP HERE
Talking Points:
GBP/USD Technical Strategy: Flat
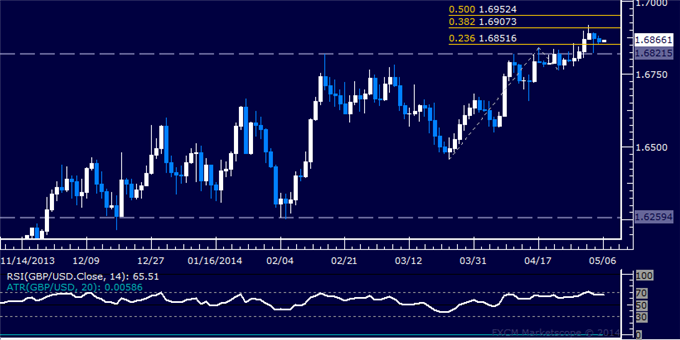
Support: 1.6593 (23.6% Fib ret.), 1.6452 (38.2% Fib ret.)
Resistance: 1.6742 (Feb 14 close), 1.6811 (23.6% Fib exp.)
The British Pound may be preparing to turn lower against the US Dollar after prices put in a Bearish Engulfing candlestick pattern below resistance at 1.6742, the February 14 close. Near-term support is at 1.6593, the 23.6% Fibonacci retracement, with a break below that targeting the 38.2% level at 1.6452. Alternatively, a reversal above 1.6742 eyes the 23.6% Fib expansion at 1.6811.
A reasonable invalidation point for a short position here is 1.6822, the February 17 high. Assuming a target at 1.6593, that skews risk/reward parameters against taking a trade. We will opt to wait for double top confirmation on a close below initial support to re-evaluate the setup.
Confirm your chart-based trade setups with the Technical Analyzer. New to FX? Start Here!
Daily Chart - Created Using FXCM Marketscope 2.0
--- Written by Ilya Spivak, Currency Strategist for DailyFX.com
DailyFX provides forex news and technical analysis on the trends that influence the global currency markets.
Learn forex trading with a free practice account and trading charts from FXCM.
