Forex: GBP/USD Technical Analysis – Four-Month Support at Risk
To receive Ilya's analysis directly via email, please SIGN UP HERE
Talking Points:
GBP/USD Technical Strategy: Flat
Support: 1.6536 (50% Fib ret.), 1.6469 (61.8% Fib ret.)
Resistance: 1.6604 (38.2% Fib ret.), 1.6695 (trend line)
The British Pound continued to decline against the US Dollar as expected, with sellers now testing critical support marked by a rising trend line set from mid-November. This barrier is reinforced by the 61.8% Fibonacci retracement at 1.6469, with a break downward exposing the 76.4% level at 1.6386. Alternatively, a turn above resistance at 1.6536 – the 50% Fib – targets the 38.2% retracement at 1.6604.
Prices are too close to relevant support to justify a short position from a risk/reward perspective. On the other hand, entering a long trade looks premature absent a defined bullish reversal signal. We will continue to stand aside for now, waiting for a more attractive setup to present itself.
Confirm your chart-based trade setups with the Technical Analyzer. New to FX? Start Here!
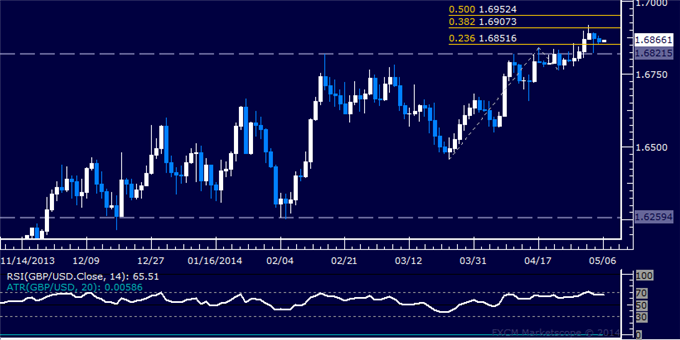
Daily Chart - Created Using FXCM Marketscope 2.0
--- Written by Ilya Spivak, Currency Strategist for DailyFX.com
DailyFX provides forex news and technical analysis on the trends that influence the global currency markets.
Learn forex trading with a free practice account and trading charts from FXCM.
