Forex: USD/CAD Technical Analysis – Looking for Long Entry Setup
To receive Ilya's analysis directly via email, please SIGN UP HERE
Talking Points:
USD/CAD Technical Strategy: Flat
Support: 1.0965 (Triangle bottom), 1.0952 (trend line)
Resistance: 1.1173 (Triangle top), 1.1194-1.1223 (Feb 21, Jan 31 highs)
The US Dollar may be preparing to launch its next push higher against its Canadian namesake. A period of consolidation since late January has taken the shape of a Triangle chart formation, a setup hinting at upside continuation. Clearing the Triangle top (now at 1.1173) exposes swing highs in the 1.1194-1.1223 area. Triangle support is currently at 1.0965 and is reinforced by a rising trend line at 1.0952.
The Triangle setup is not actionable until confirmation is seen on a daily close above the pattern’s upper boundary. We look for that to materialize before looking for an attractive long trade setup.
Confirm your chart-based trade setups with the Technical Analyzer. New to FX? Start Here!
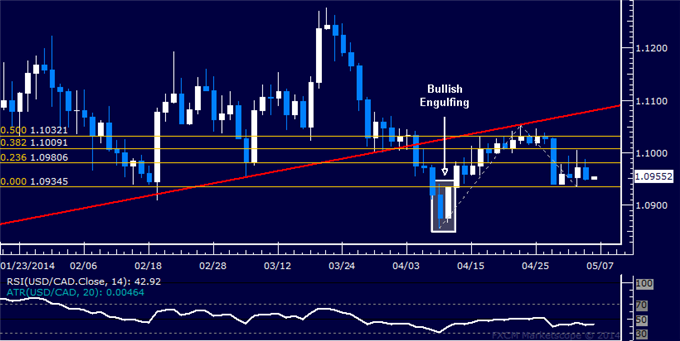
Daily Chart - Created Using FXCM Marketscope 2.0
--- Written by Ilya Spivak, Currency Strategist for DailyFX.com
DailyFX provides forex news and technical analysis on the trends that influence the global currency markets.
Learn forex trading with a free practice account and trading charts from FXCM.
