GBP/JPY Technical Analysis – Critical Trend Line Under Fire
To receive Ilya's analysis directly via email, please SIGN UP HERE
Talking Points:
GBP/JPY Technical Strategy: Flat
Support: 170.26-169.86 (trend line from Aug’13, 38.2% Fib ret.)
Resistance:171.27 (23.6% Fib ret.), 173.13-56 (Mar 7, Apr 3 swing highs)
The British Pound may be on the verge of a major downward reversal against the Japanese Yen as prices test below rising trend line set from August 2013. This barrier is reinforced by the 38.2% Fibonacci retracement at 169.86. A break above the latter level on a daily closing basis initially exposes the 50% Fib at 168.71. Alternatively, a turn above resistance at 171.27, the 23.6% retracement, aims for the 173.13-56 area marked by the March 7 and April 3 swing highs.
Risk/reward considerations argue against entering short with prices trading in close proximity to relevant support. On the other hand, taking up the short side looks premature absent a defined bearish reversal signal. As such, we will remain flat for now.
Confirm your chart-based trade setups with the Technical Analyzer. New to FX? Start Here!
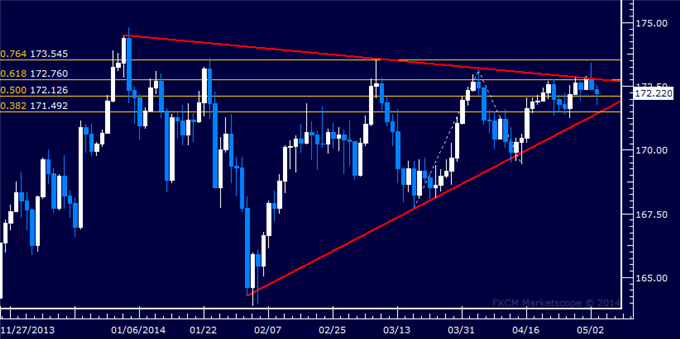
Daily Chart - Created Using FXCM Marketscope 2.0
--- Written by Ilya Spivak, Currency Strategist for DailyFX.com
DailyFX provides forex news and technical analysis on the trends that influence the global currency markets.
Learn forex trading with a free practice account and trading charts from FXCM.
