GBP/USD Blows Through 1.5600 and into 52 Week Average
Daily
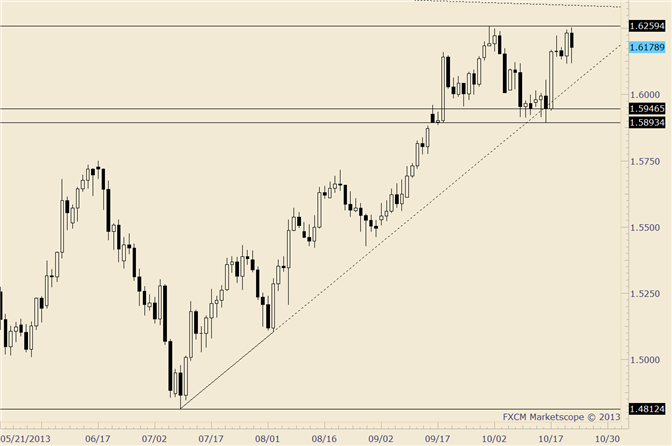
Chart Prepared by Jamie Saettele, CMT using Marketscope 2.0
Interested in automated trading with Mirror Trader?
FOREXAnalysis: The GBPUSD blasted through its 200 day average (price closed .73% above its 200 day average…the highest above since January) and yesterday’s outside day and closed the day at the 88.6% retracement of the decline from 6/17. From a Fibonacci perspective, that is the final (although rarely cited) retracement. The level is also marked by the 52 week average and upward sloping line that extends off of the 7/25 and 8/8 highs. The channel is slightly higher, at about 1.5700 on Friday. The rally would consist of 2 equal legs from the July low at 1.5722, which is also the close of the high day in June. If price trades above the June high of 1.5750, then the 61.8% retracement of the Jan-March decline comes in at 1.5788 and the November 2012 low at 1.5826.
FOREX Trading Strategy: Plan on shorting below Thursday’s outside day is out the window for now. Sitting tight. Refuse to chase upside given longer term bearish implications.
LEVELS: 1.5474 1.5546 1.5593 1.5700 1.5720 1.5788
DailyFX provides forex news and technical analysis on the trends that influence the global currency markets.
Learn forex trading with a free practice account and trading charts from FXCM.
