GBP/USD Dark Cloud Cover Warns Of Correction Near Key Resistance
Talking Points
GBP/USD Technical Strategy: Pending Short
Dark Cloud Cover emerges following pullback from 1.6900
Bullish reversal signal absent on four hour chart
GBP/USDhas given back some of its recent gains following a failure to crack the critical 1.6900 handle. The pullback has prompted the emergence of a Dark Cloud Cover candlestick pattern which suggests a potential bearish reversal. However, the formation awaits confirmation from an ensuing down-day, which if witnessed, could put 1.6760 back on the cards.
GBP/USD: Fails To Close Above Key Resistance At 1.6900
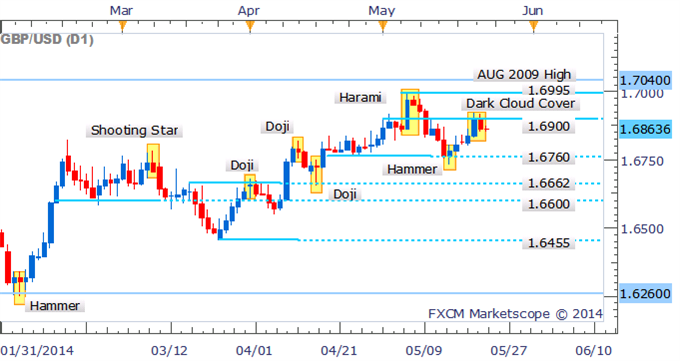
Daily Chart - Created Using FXCM Marketscope 2.0
Examining intraday price action; the Harami near 1.6900 suggested some hesitation from traders near the noteworthy level of resistance. The failure to close above 1.6900 indicates the bulls have seemingly lost their grip on prices and at this stage seem unprepared to return, given a reversal signal is seemingly absent.
GBP/USD: Bulls Lacking Enough Conviction To Push Through 1.6900

4 Hour Chart - Created Using FXCM Marketscope 2.0
By David de Ferranti, Market Analyst, DailyFX
Follow David on Twitter: @Davidde
To receive David’s analysis directly via email, please sign up here.
Learn how to read candlesticks to help identify trading opportunities with the DailyFX Candlesticks Video Course.
DailyFX provides forex news and technical analysis on the trends that influence the global currency markets.
Learn forex trading with a free practice account and trading charts from FXCM.
