GBP/USD to Face Slowing 3Q GDP- NZD/USD Bear Flag in Play
DailyFX.com -
Talking Points:
- GBP/USD to Threaten Bullish RSI Momentum on Dismal 3Q U.K. GDP.
- NZD/USD Bear Flag in Play Ahead of RBNZ Policy Meeting; Verbal Intervention on Tap?
- USDOLLAR Looks Poised to Resume Bullish Trend Amid RSI Breakout.
For more updates, sign up for David's e-mail distribution list.
GBP/USD
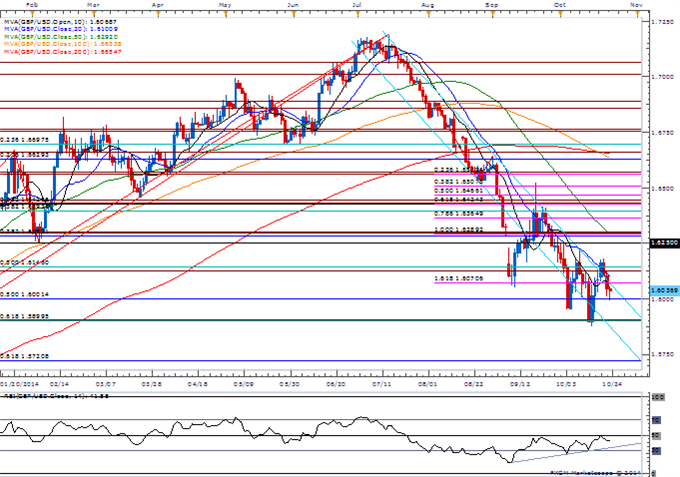
GBP/USD continues to carve string of lower-highs ahead of the advance 3Q U.K. Gross Domestic Product (GDP) report, which is expected to show the grow rate increasing 0.7% following a 0.9% advance during the three-months through June.
Will watch 1.5890 (61.8% retracement) to 1.5900 (50.0% expansion) for support on a close-basis, but the next downside level of interest comes in around 1.5720 (61.8% retracement).
DailyFX Speculative Sentiment Index (SSI) shows the retail-crowd remains net-long on GBP/USD, with the ratio currently standing at +1.17.
NZD/USD
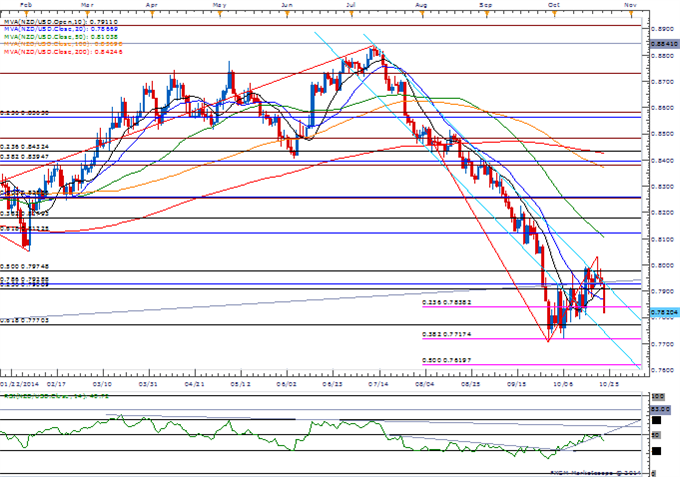
NZD/USD looks poised to resume the downward trend from July as the Relative Strength Index (RSI) fails to retain the bullish momentum from the previous month.
In light of the dismal 3Q CPI print, may see the Reserve Bank of New Zealand (RBNZ) sound more dovish at the October 29 meeting while retaining the verbal intervention on the kiwi.
With the bearish RSI break, will watch the monthly low (0.7706), with the next downside region of interest coming in around 0.7620 (50.0% expansion).
Join DailyFX on Demand for Real-Time SSI Updates Across the Majors!
Read More:
NZDCAD Outside Reversal Day Favors Short Scalps Sub-9050
Price & Time: Deciphering the Short-Term USD Wiggles
USDOLLAR(Ticker: USDollar):
Index | Last | High | Low | Daily Change (%) | Daily Range (% of ATR) |
DJ-FXCM Dollar Index | 11044.05 | 11052.89 | 11016.32 | 0.22 | 51.58% |

Chart - Created Using FXCM Marketscope 2.0
The Dow Jones-FXCM U.S. Dollar Index bullish flag pattern taking shape; topside targets favored as RSI breaks out of the bearish momentum from earlier this month.
With the U.S. CPI print highlighting sticky inflation, may see interest rate expectations pick up ahead of the Federal Open Market Committee (FOMC) meeting next week as the central bank is widely expected to move away from its easing cycle.
Given the string of failed attempts to close below 10,950 (38.2% retracement), the USDP::AR appears to have carved a lower-high in October, which brings 11,120 (1.618) to 11,138 (0.618%) back on our radar.
Join DailyFX on Demand for Real-Time SSI Updates!
Release | GMT | Expected | Actual |
Chicago Fed National Activity Survey (SEP) | 12:30 | 0.15 | 0.47 |
Initial Jobless Claims (OCT 18) | 12:30 | 281K | 283K |
Continuing Claims (OCT 11) | 12:30 | 2380K | 2351K |
House Price Index (MoM) (AUG) | 13:00 | 0.3% | 0.5% |
Markit Purchasing Manager Index Manufacturing (OCT P) | 13:45 | 57.0 | 56.2 |
Leading Indicators (SEP) | 14:00 | 0.7% | |
Kansas City Fed Manufacturing Activity (OCT) | 15:00 | 6 |
Click Here for the DailyFX Calendar
--- Written by David Song, Currency Analyst
To contact David, e-mail dsong@dailyfx.com. Follow me on Twitter at @DavidJSong.
To be added to David's e-mail distribution list, please follow this link.
Trade Alongsidethe DailyFX Team on DailyFX on Demand
Looking to use the DailyFX Trade Signals LIVE? Check out Mirror Trader.
New to FX? Watch this Video
Join us to discuss the outlook for the major currencies on the DailyFXForums
DailyFX provides forex news and technical analysis on the trends that influence the global currency markets.
Learn forex trading with a free practice account and trading charts from FXCM.


