GBP/USD Technical Analysis 02.12.2013
GBP/USD Technical Analysis - Prices are testing through a critical support cluster marked by two alternative rising trend linesset from mid-January 2009, based against the May 20 2010 low and the other against the June 1 2012 low. The first key downside barrier is at 1.5571, the 38.2% Fibonacci expansion, with a break below that targeting the 50% level at 1.5488. Near-term resistance is at 1.5733. We remain short for now.
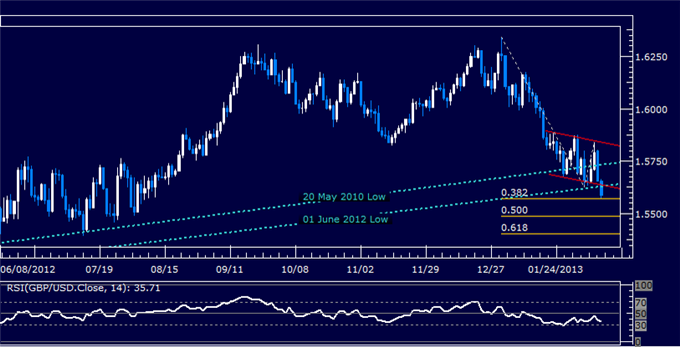
Daily Chart - Created Using FXCM Marketscope 2.0
--- Written by Ilya Spivak, Currency Strategist for Dailyfx.com
To contact Ilya, e-mail ispivak@dailyfx.com. Follow Ilya on Twitter at @IlyaSpivak
To be added to Ilya's e-mail distribution list, please CLICK HERE
New to FX? Watch this Video. For live market updates, visit the Real Time News Feed
DailyFX provides forex news and technical analysis on the trends that influence the global currency markets.
Learn forex trading with a free practice account and trading charts from FXCM.
