GBP/USD Technical Analysis – Resistance Met Below 1.70
To receive Ilya's analysis directly via email, please SIGN UP HERE
Talking Points:
GBP/USD Technical Strategy: Flat
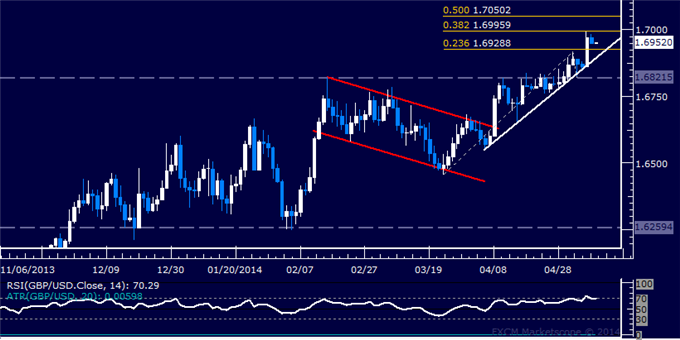
Support:1.6929 (23.6% Fib exp.), 1.6893 (trend line)
Resistance: 1.6996 (38.2% Fib exp.), 1.7050 (50% Fib exp.)
The British Pound is stalling below the 1.70 figure having soared to the highest level in nearly five years against the US Dollar. Near-term resistance is at 1.6996, marked by the 38.2% Fibonacci expansion. A break above this barrier on a daily closing basis exposes the 50% level at 1.7050. Near-term support is at 1.6929, the 23.6% level, with a turn below that targeting a rising trend line set from early April, now at 1.6893.
Current positioning does not appear to offer an actionable trade setup. We will continue to wait on the sidelines for now, waiting for a more attractive entry opportunity to present itself.
Confirm your chart-based trade setups with the Technical Analyzer. New to FX? Start Here!
Daily Chart - Created Using FXCM Marketscope 2.0
--- Written by Ilya Spivak, Currency Strategist for DailyFX.com
DailyFX provides forex news and technical analysis on the trends that influence the global currency markets.
Learn forex trading with a free practice account and trading charts from FXCM.
