Gold May Have Set a Top, SPX 500 Snaps Three-Day Winning Streak
DailyFX.com -
Talking Points:
US Dollar Flirting with Renewing Uptrend After Pullback
S&P 500 Snaps 3-Day Rebound as Prices Hit Resistance
Crude Oil Struggling to Rise, Gold May Have Set a Top
Can’t access the Dow Jones FXCM US Dollar Index? Try the USD basket on Mirror Trader. **
US DOLLAR TECHNICAL ANALYSIS – Prices moved lower as expected after producing a bearish Dark Cloud Cover candlestick pattern. A daily close below the 23.6% Fibonacci retracement at 10959 exposes the 10845-74 area marked by a falling channel bottom and the 38.2% level. Alternatively, a push above the channel top at 11026 clears the way for a test of the 11102-43 zone (23.6% Fib expansion, October 3 high).
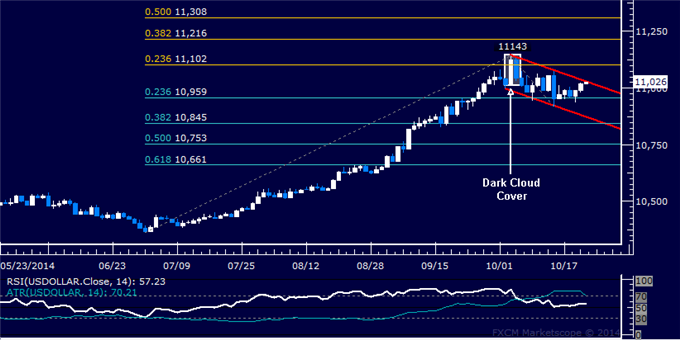
Daily Chart - Created Using FXCM Marketscope 2.0
** The Dow Jones FXCM US Dollar Index and the Mirror Trader USD basket are not the same product.
S&P 500 TECHNICAL ANALYSIS – Prices stalled after three days of aggressive recovery, finding resistance at 1944.50 marked by the intersection of the 61.8% Fibonacci retracement and a falling trend line set from mid-September. A break above this barrier on a daily closing basis exposes the 76.4% level at 1974.10. Alternatively, a turn below the 50% Fib at 1920.50 targets the 38.2% retracement at 1896.50.

Daily Chart - Created Using FXCM Marketscope 2.0
GOLD TECHNICAL ANALYSIS – Prices put in a bearish Evening Star candlestick pattern below resistance at a falling trend line set from mid-July, hinting a move lower is ahead. Near-term support is at 1231.49, the 14.6% Fibonacci expansion, with a break below that exposing the 23.6% level at 1216.87. Near-term resistance is at 1255.20, the October 21 high.
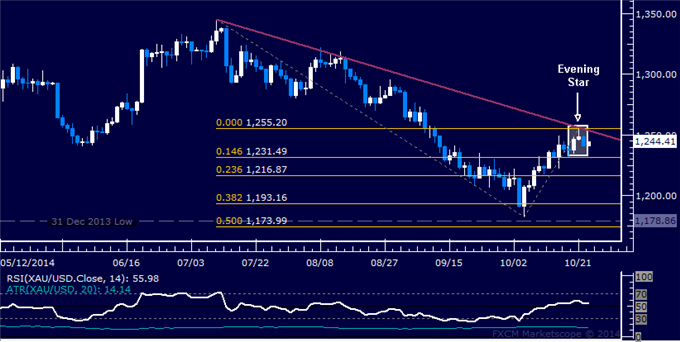
Daily Chart - Created Using FXCM Marketscope 2.0
CRUDE OIL TECHNICAL ANALYSIS – Prices put in a Bullish Engulfing candlestick pattern, hinting a bounce may be ahead. A break above the 87.67-88.17 area marked by the 14.6% Fibonacci retracement and channel floor support-turned-resistance exposes the 23.6% level at 90.62. Near-term support is at 82.88, the October 15 low.
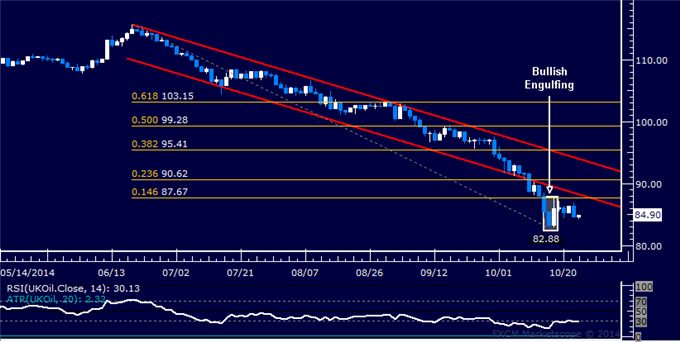
Daily Chart - Created Using FXCM Marketscope 2.0
--- Written by Ilya Spivak, Currency Strategist for DailyFX.com
To receive Ilya's analysis directly via email, please SIGN UP HERE
Contact and follow Ilya on Twitter: @IlyaSpivak
DailyFX provides forex news and technical analysis on the trends that influence the global currency markets.
Learn forex trading with a free practice account and trading charts from FXCM.
