Gold Struggling Below $1250, SPX 500 Trying to Retake 1900 Figure
DailyFX.com -
Talking Points:
US Dollar Remains in Digestion Mode at Channel Support
S&P 500 Attempting to Clear a Path Above 1900 Figure
Crude Oil Hints at Bounce, Gold Capped Below $1250/oz
Can’t access the Dow Jones FXCM US Dollar Index? Try the USD basket on Mirror Trader. **
US DOLLAR TECHNICAL ANALYSIS – Prices declined as expected after putting in a bearish Dark Cloud Cover candlestick pattern. Near-term support is at 10898, marked by a falling channel bottom, with a break below that on a daily closing basis exposingthe 38.2% Fibonacci retracementat 10845. Alternatively, a reversal above the channel top at 11052 opens the door for a challenge of 11143, the October 3 high.

Daily Chart - Created Using FXCM Marketscope 2.0
** The Dow Jones FXCM US Dollar Index and the Mirror Trader USD basket are not the same product.
S&P 500 TECHNICAL ANALYSIS – Prices recovered after hitting a six-month low, with buyers testing resistance marked by the 38.2% Fibonacci retracement at 1896.50. A daily close above this barrier exposes the 50% level at 1920.50. Alternatively, a turn back below the 23.6% Fib at 1866.90 targets the 14.6% retracement at 1848.60.

Daily Chart - Created Using FXCM Marketscope 2.0
GOLD TECHNICAL ANALYSIS – Prices advanced as expected after putting in a bullish Piercing Line candlestick pattern. A break above the 38.2% Fibonacci retracement at 1244.88 on a daily closing basis exposes the 50% level at 1264.01. Alternatively, a turn below the 23.6% Fib at 1221.20 targets the 14.6% retracement at 1206.61.
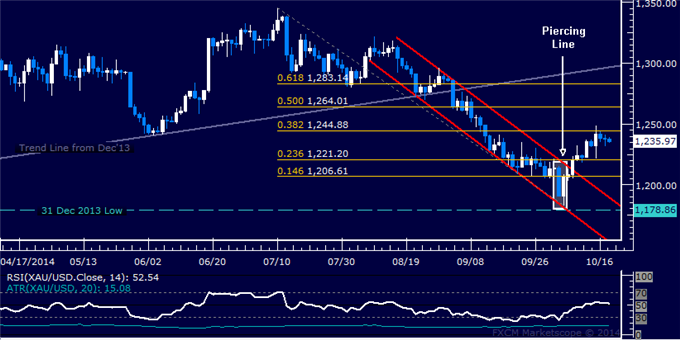
Daily Chart - Created Using FXCM Marketscope 2.0
CRUDE OIL TECHNICAL ANALYSIS – Prices put in a Bullish Engulfing candlestick pattern, hinting a bounce may be ahead. A break above the 14.6% Fibonacci retracement at 87.67 exposes channel floor support-turned-resistance at 88.88. Near-term support is at 82.88, the October 15 low.

Daily Chart - Created Using FXCM Marketscope 2.0
--- Written by Ilya Spivak, Currency Strategist for DailyFX.com
To receive Ilya's analysis directly via email, please SIGN UP HERE
Contact and follow Ilya on Twitter: @IlyaSpivak
DailyFX provides forex news and technical analysis on the trends that influence the global currency markets.
Learn forex trading with a free practice account and trading charts from FXCM.
