
Market Outlook: Indicator Warns Market Could Go Down in Flames - Should We Trust It?
Major stock market averages are less than 3% from all-time highs, but the bears have found new reasons to doubt the rally. Bears got it right last week, but the long-term trend still looks bullish.
Pullbacks Are Part of Bull Markets
No market ever moves straight up or straight down. Countertrend moves are common, and during the past six trading days, SPDR S&P 500 (SPY) retraced about one-third of its gains since the start of the year.

Retracements are normal and many traders look to buy on these pullbacks. Some traders prefer to use a Fibonacci retracement level of 38.2%, but this ratio is close to 33%, and market retracements, just like primary price moves, occur in varying amounts.
The important point is that we are less than 3% below all-time highs on SPY and SPDR Dow Jones Industrial Average (DIA). The trend remains up until we see evidence of a reversal instead of a pullback. Until SPY closes below $149, I believe the uptrend remains intact.
Last week, SPY did lose 2.09%, and seven of the nine major market sector ETFs were down. Looking at how the sector ETFs performed offers a few insights.
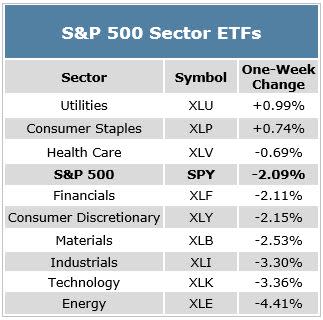
In a downturn, there will still be some winners. Defensive sectors -- utilities, consumer staples and health care -- outperformed the market last week. If this pullback turns into a significant decline, it looks like defensive stocks will be the best place to be invested.
It is also worth noting that news reports highlighted a sell signal from the Hindenburg Omen last week. This indicator is triggered when five different conditions are met, including that the daily number of NYSE new 52-week highs and the daily number of new 52-week lows must both be greater than 2.2% of total NYSE issues traded that day.
Personally, I wonder why 2.2% is used. Indicators that rely on values like that, a number that has no relationship to the current price action and could just as easily be any other number, seem to be curve fit to the past. However, the Hindenburg Omen probably did not test well when a value like 2% or 2.3% was used, for example. This indicator seems to be engineered to precisely catch past market declines.
Interestingly, one of the sites that explained the Hindenburg Omen noted how well it worked and added that it signaled a sell near the lows in early 2009. Most traders realize lows occur at bottoms, and an indicator predicting a crash before one of the greatest rallies in stock market history should be suspect.
In testing, I have found that the Hindenburg Omen is unreliable. The chart below shows what would have happened if you took all signals and held your short positions for time frames as short as one day and as long as 220 days. The profit factor is shown, a measure of how tradable a system is. When the profit factor is less than 1, as it is for almost all holding periods in this test, the system is generally not tradable because the total losses would exceed the total amount of the winning trades.

The Hindenburg Omen did offer a timely sell signal in 1987, as well as before several other sharp down moves. But overall it is just one indicator and it is not highly reliable when applied to a large set of data. (I began testing in 1986 because that is the earliest date when the required breadth data is available from my data provider.)
However, we don't need to rely on this indicator. In 1987, the Dow was technically weak before the crash. So traders had other sell signals besides the Hindenburg Omen.
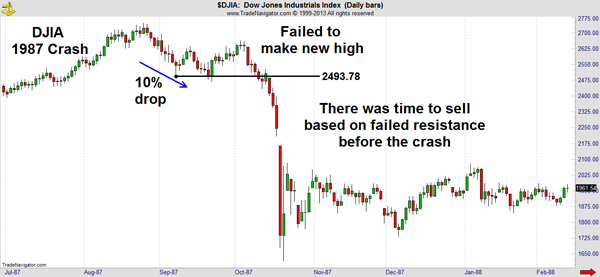
Currently, we do not see a pattern similar to the one that existed before the crash in 1987. Rather than using curve fit indicators like the Hindenburg Omen, traders should remain long as long as SPY trades above support at $149.
Recommended Trade Setup:
-- Maintain long position in SPY
-- Maintain stop-loss at $149
-- Maintain year-end price target of $167
Gold Down 11% in Two Weeks
SPDR Gold Trust (GLD) fell 5.9% last week, topping the 5.8% loss seen a week earlier. As prices fell, selling picked up.
GLD holds physical gold to back its assets. At the end of last week, the ETF held 1,123.06 tons of gold, an 8.04% decline since the end of March. The price is down 12.3% over that same time. GLD now holds about $50 billion worth of gold.
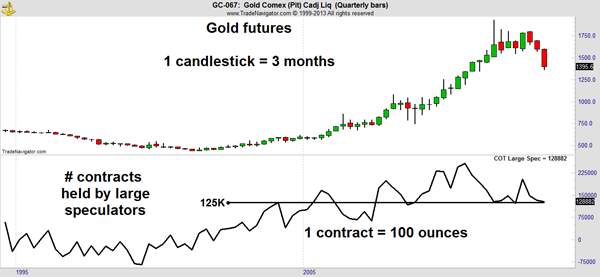
In the futures market, large speculators as a group are long about 129,000 contracts. Each contract covers 100 ounces of the metal. With gold at $1,395 an ounce, hedge funds have positions with a total value of almost $18 billion.
The Chicago Mercantile Exchange, the exchange where gold futures are traded in the United States, requires a margin deposit of about 5% of the contract amount for each contract. The minimum margin requirement for all gold futures contracts is about $900 million.
The losses in gold are marked to market daily, meaning they are recognized each night. Large losses like we have seen the past two weeks can lead to margin calls and fuel more selling. Until we see a drop in the gold holdings of hedge funds, this market holds high risk.
PowerShares DB Gold Short ETN (DGZ), an inverse fund that goes up when gold prices fall, gained 5% last week and remains the best trade in the metals sector.
Recommended Trade Setup:
-- Hold DGZ
-- Raise stop-loss to $12.65
-- Increase price target to $14.60
This Week's News
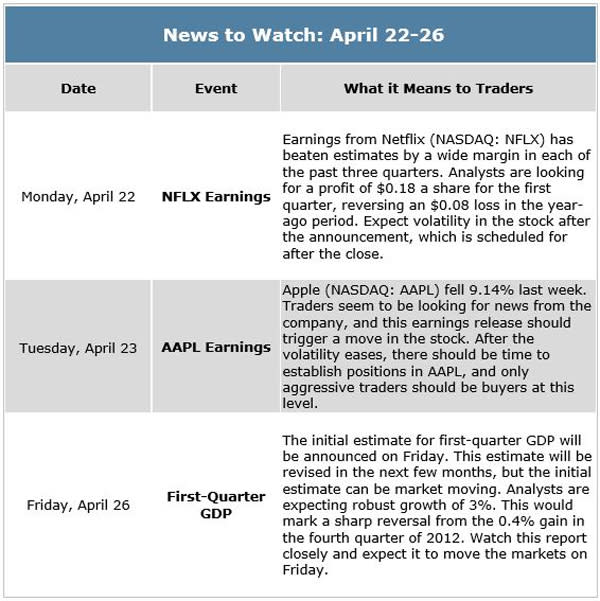
Almost 25% of the companies in the S&P 500 index will be reporting earnings this week. Here are some important events to watch for:
Related Articles
Blue-Chip Gold Stock Could Yield 78% a Year
Warning: System Says This Asset Class Is No Longer Safe
Pocket an Instant Profit for the Chance to Buy This Retailer at a Steep Discount
