NZD/USD Long Trade Triggered on Triangle Break
NZD/USD Technical Strategy: Long at 0.8509, Targeting 0.8571
Prices completed a bullish Ascending Triangle chart pattern with a break above resistance in the 0.8460-75 area. We will now enter long, initially targeting the August 31 2011 high at 0.8571 with a stop-loss set on a daily close below 0.8460. A breach above 0.8571 on a daily closing basis will prompt a revision of the stop-loss to breakeven mark and expose a larger objective at 0.8788, the measured Triangle target and 2011 closing high.
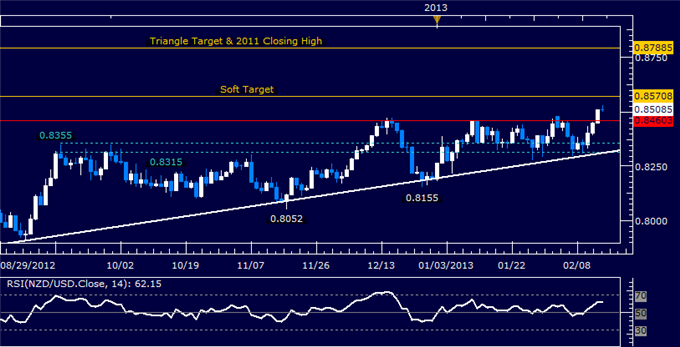
Daily Chart - Created Using FXCM Marketscope 2.0
--- Written by Ilya Spivak, Currency Strategist for Dailyfx.com
To contact Ilya, e-mail ispivak@dailyfx.com. Follow Ilya on Twitter at @IlyaSpivak
To be added to Ilya's e-mail distribution list, please CLICK HERE
New to FX? Watch this Video. For live market updates, visit the Real Time News Feed
DailyFX provides forex news and technical analysis on the trends that influence the global currency markets.
Learn forex trading with a free practice account and trading charts from FXCM.
