Seeds are Sewn for Big Moves in New Zealand Dollar and British Pound
Viewed in the context of big picture market patterns, what happens in the next week could be significant to trends for the rest of the year.
NZDUSD
Weekly
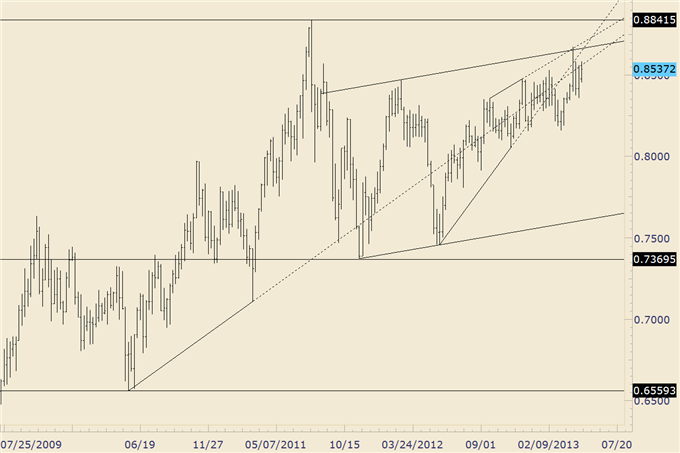
Chart Prepared by Jamie Saettele, CMT using Marketscope 2.0
Are you new to FX or curious about your trading IQ?
FOREX Analysis: The one week parabolic move into the April high and quick reversal is consistent with an important top. Just as important, the level that produced the top is significant. Corrective moves tend to form parallel channels (in Elliott, draw a line that connects the lows off of the origin of wave A and the end of wave B and extend a parallel off of the end of wave A; that line approximates the end of wave C). The high is also marked by the 4/12 close, a Friday that preceded the 4/15 gap down and large range down day. Viewed in the context of an impulsive decline from the 2011 high, it is possible that the NZDUSD will trade below .7370 before trading above .8585.
FOREX Trading Strategy: I don’t label waves on my charts as much I used to. Wave counts are subject to interpretation and the presence of labels promotes a rigidity that is a detriment to successful trading. I prefer to reserve labels for patterns that are exceptionally clean. Given the bigger picture and the potential for a sharp decline, it’s worth zooming in and labeling waves since the April high (see below). Impulsive weakness from .8675 was succeeded by a complex flat (complex because the rally from .8360 is a ‘3’). Weakness from .8585 is impulsive and the rally from .8454 is a textbook 3 wave move. The heightened emotions in this market promote clean wave structure. If the presented interpretation is correct, then the NZDUSD is on the verge of a ‘3rd of a 3rd’ wave plunge. I’m short and looking to add early next week…cover half at .8400.
NZDUSD
60 Minute

Chart Prepared by Jamie Saettele, CMT using Marketscope 2.0
Are you new to FX or curious about your trading IQ?
GBPUSD
Daily

Chart Prepared by Jamie Saettele, CMT using Marketscope 2.0
Are you new to FX or curious about your trading IQ?
FOREX Analysis: After 6 up days, the GBPUSD has churned for 2 days. In fact, an outside day unfolded Friday which could pave the way for separation from this level on a break of the recent range. There is no certainty in market analysis or trading but this is a perfect place for a top. The 50% retracement of the decline from the January high, channel resistance and internal trendline that dates to September 2012 are a formidable barrier. When considering the break of the 4 year triangle (red line on chart is former triangle support) in February, it is possible that an incredibly important top is in place at the May 1 high. Even if a top of importance is in place, there will be bounces along the way…especially in the early going. 1.5420 may be a level that produces a decent bounce.
FOREX Trading Strategy: Short against last week’s high and looking to increase the position below 1.5480 with a plan to cover half at 1.5420. It’s probably too early to consider an automated breakout strategy. Markets tend to trade sharply in both directions before the ‘straight line’ move gets underway.
USDJPY
60 Minutes
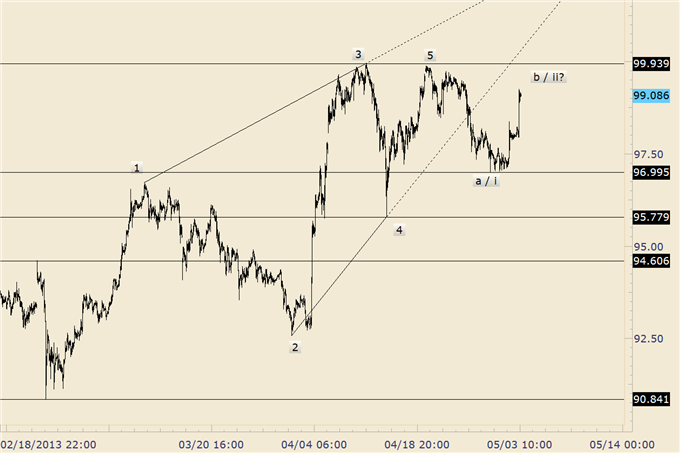
Chart Prepared by Jamie Saettele, CMT using Marketscope 2.0
Are you new to FX or curious about your trading IQ?
FOREX Analysis: Last week’s comments remains valid - “the USDJPY has responded to the 50% retracement of the decline from the 2007 high.” The USDJPY responded to the same level this week. Only in a paradoxical world like markets would the USDJPY reverse before 100.00 and the major 101.26/67 area. Those levels are still possible of course but the close below the diagonal support line is an early sign that something else may be going on. After numerous false starts on the downside, beginning with the 2/25 collapse, traders are conditioned to buy the dip. Eventually, this mentality will aid in accelerating a nasty decline, but within a multiyear uptrend. So is this the beginning of the ‘nasty decline’? I think so but I know that I don’t want to be long when it happens. Consider also that a seasonally weak period for equities is upon us…begins in June).
There are a lot of levels to get through before one can be confident that a larger drop is underway. A drop below the 4/16 low at 95.65 and line parallel to the one that extends off of the 3/12 and 4/11 highs would be concrete evidence that something bigger is brewing on the downside. Candlestick traders will notice a bearish engulfing pattern on the weekly. The action is telling. The previous week’s close was the highest in almost exactly 3 years. Price opened above last week’s high and closed below last week’s open. Although far too early for most to consider, it’s worth noting the line that extends off of the 1998 and 2002 tops. That line could once again come into play, this time as support, as it did in 2007.”
FOREX Trading Strategy: 5 waves down and 3 waves up since the 4/22 high favor a near term bearish interpretation. Today’s high is just a few pips above the close of the 4/22 reversal day. In other words, the rally stopped at a level consistent with a larger topping process. Short is obviously against the grain here but evidence is sufficient to take a stand against the April high for at least sub 97.00.
EURUSD and USDCHF
Daily

Chart Prepared by Jamie Saettele, CMT using Marketscope 2.0
Are you new to FX or curious about your trading IQ?
FOREX Analysis: I’ve received questions about comments I make on Twitter with respect to EURUSD and USDCHF non-confirmation or divergence. The Euro and Swiss Franc are highly correlated at the moment. If one makes a high or low and the other doesn’t, then the moves are not confirmed and ‘something is up’. The latest daily instance occurred on Wednesday (May 1) when the EURUSD made a new high but the USDCHF did not make a new low (CHF did not make a new high). This also happens on an intraday basis…it happened Friday (see next chart).
Warning…I’m going to get ahead of myself now. When viewed in the context of potential head and shoulders patterns (inverse for USDCHF), it’s possible that we don’t see the May 1st prices for the rest of the year if not longer. If a head and shoulders pattern plays out, then both shoulders and the right side of the ‘neck’ will be marked by non-confirmations. Also, the USDCHF inverse head and shoulders would probably be more powerful than the EURUSD head and shoulders. The USDCHF exhibits an upward sloping neckline and higher right shoulder whereas the EURUSD exhibits a slightly upward sloping neckline and higher right shoulder (point being that the USDCHF is more bullish than the EURUSD is bearish). The implications for EURCHF would be bullish but not nearly as bullish as USDCHF. To be clear, breaks through the March high for USDCHF and April low for EURUSD are needed in order to confirm these patterns.
Market confirmation logic was pioneered by Henry Dow…this is Dow Theory. The logic can be applied to related assets, such as the Australian Dollar and New Zealand Dollar (NZDUSD high in April was not confirmed by AUDUSD), and gold and silver (Friday’s high in gold was not confirmed by silver).
EURUSD and USDCHF
15 Minutes
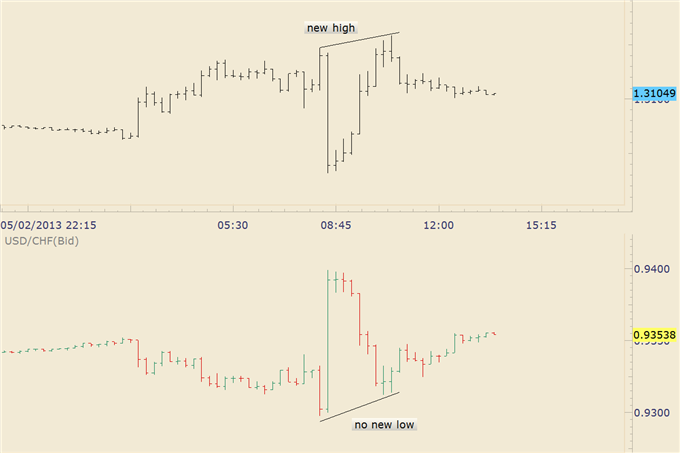
Chart Prepared by Jamie Saettele, CMT using Marketscope 2.0
Are you new to FX or curious about your trading IQ?
--- Written by Jamie Saettele, CMT, Senior Technical Strategist for DailyFX.com
To contact Jamie e-mail jsaettele@dailyfx.com. Follow him on Twitter @JamieSaettele
Subscribe to Jamie Saettele's distribution list in order to receive actionable FX trading strategy delivered to your inbox.
Jamie is the author of Sentiment in the Forex Market.
DailyFX provides forex news and technical analysis on the trends that influence the global currency markets.
Learn forex trading with a free practice account and trading charts from FXCM.
