Stocks To Watch In Market Weakness
While there are still stocks with strong technical momentum, market weakness has us looking at charts poised for downside moves.
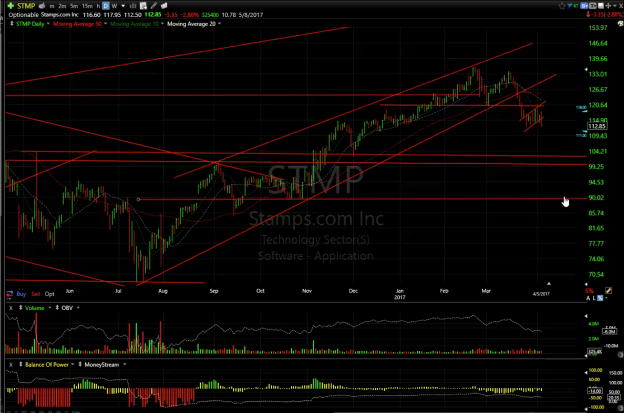
Stamps.com Inc. (NASDAQ: STMP) broke down on Wednesday, falling $3.35 to $112.85 on no news. The stock, which broke down from a long-term up-channel last month, had been consolidating in the last week in a bear flag. Wednesday's break of the flag and close near the low for the day positions the stock for downside continuation towards the low from November near $100.
Ubiquiti Networks Inc (NASDAQ: UBNT) looks like it's rolling over as well. The stock plunged in February, by more than 20% in just two sessions, and tried to rally back. In recent days, the stock has broken down from the short-term rising channel, falling for five session in a row on no news. Watch for a break of recent lows at around $47, followed by a test of $42 and then last June's low near $37.
On the long side, The Greenbrier Companies, Inc (NYSE: GBX) broke out on Wednesday, up $4.30, or 10%, to $47.25 on a whopping 3.8 million shares, which is 6x its average volume. The maker of railroad freight car equipment beat Wall Street expectations in its earnings release Wedneday. The stock had been in a nearly 3-month declining wedge pattern since its surge in January to $49.50, and Wednesday's move exploded the stock out of the wedge. The stock nearly reached the January resistance high intraday, getting up to $49, and looks like it has more room to run.
Vertex Pharmaceuticals Incorporated (NYSE: VRTX) had a strong follow-through session on Wednesday, up $1.82 to $114.11 on 4 million shares. The move confirmed Tuesday's breakout of a mini-wedge the stock has been in since it gapped up 19 points on March 29. The company at that time announced that two phase 3 trials for its cystic fibrosis treatment showed positive results. Watch for a move next to $128 and then $135, although the stok could first test the $108-$110 zone if market weakness continues.
See Harry's video chart analysis on these stocks.
See more from Benzinga
Even Beer Companies Use AI And Machine Learning Technologies
Advanced Micro Devices Selloff Triggers Heavy May Call Buying
© 2017 Benzinga.com. Benzinga does not provide investment advice. All rights reserved.
