US Dollar Attempting Recovery as SPX 500 Keeps Pushing Higher
Talking Points
US Dollar Finds Support, Attempts to Stage Cautious Recovery
S&P 500 Upward Push Continues to Set Another Record High
Crude Oil Begins to Recover from Chart Support as Expected
To receive Ilya's analysis directly via email, please SIGN UP HERE
Can’t access to the Dow Jones FXCM US Dollar Index? Try the USD basket on Mirror Trader. **
US DOLLAR TECHNICAL ANALYSIS – Prices are testing above resistance in the in the 10416-24 region, the site of April’s shelf support and the 38.2%Fibonacci expansion. A break higher on a daily closing basis exposes the 23.6% level at 10468. Near-term support is at 10374, the 50% Fib, with a reversal back beneath that targeting the 10323-31 area (marked by the June 2012 swing high and the 61.8% expansion).

Daily Chart - Created Using FXCM Marketscope 2.0
** The Dow Jones FXCM US Dollar Index and the Mirror Trader USD basket are not the same product.
S&P 500 TECHNICAL ANALYSIS – Prices recovered as expected after showing a Spinning Top candlestick at support marked by a rising trend line set from late February. A break above resistance at 1754.40, the 100% Fibonacci expansion, has exposed the 123.6% level at 1779.80. Alternatively, dropping back below 1754.40 sees the first layer of support at 1729.00, the 76.4% Fib.

Daily Chart - Created Using FXCM Marketscope 2.0
GOLD TECHNICAL ANALYSIS – Prices broke higher as expected after putting in a bullish Morning Star candlestick pattern. Resistance is now at 1364.06, the 61.8% Fibonacci retracement, with a break above that targeting the 76.4% level at 1390.64. Near-term support is at 1342.57, the 50% Fib. A reversal back beneath that eyes the 38.2% Fib at 1321.09.

Daily Chart - Created Using FXCM Marketscope 2.0
CRUDE OIL TECHNICAL ANALYSIS– Prices rose as expected after putting in a bullish Morning Star candlestick pattern at the bottom of a falling channel set from late August. Near-term resistance is at 99.77, the 23.6% Fibonacci retracement, with a break above that targeting the channel top at 101.32. Channel bottom support is now at 96.07.
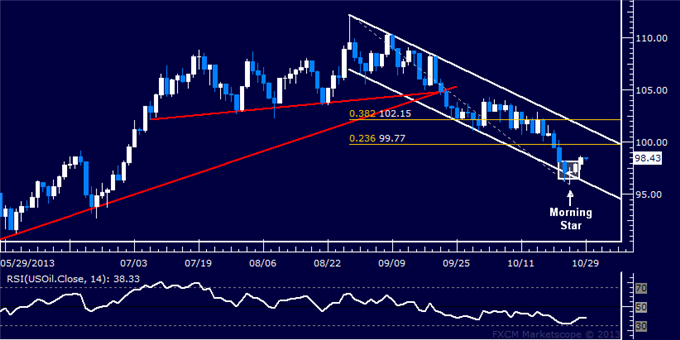
Daily Chart - Created Using FXCM Marketscope 2.0
--- Written by Ilya Spivak, Currency Strategist for DailyFX.com
Contact and follow Ilya on Twitter: @IlyaSpivak
For live market updates, visit the Real Time News Feed
DailyFX provides forex news and technical analysis on the trends that influence the global currency markets.
Learn forex trading with a free practice account and trading charts from FXCM.
