US Dollar Rally Accelerates Even as S&P 500 Edges Higher
THE TAKEAWAY: The US Dollar has managed to extend its advance even as the S&P 500 has continued to edge higher, diverging from the familiar risk on/off dynamic.
S&P 500 – Prices are edging higher after putting in a Bullish Engulfing candlestick pattern above support at a rising trend line set from late July. Initial resistance lines up at 1466.10, with a break above that targeting the top of a channel established from the June 4 low (now at 1490.10). Alternatively, a break below trend line support (now at 1445.90) exposes 1422.40.

Daily Chart - Created Using FXCM Marketscope 2.0
CRUDE OIL – Prices reversed lower from resistance at 93.60, the 23.6% Fibonacci retracement, to break below the 38.2% level at 89.44. Sellers now aim to challenge the 50% Fib at 86.04, with a push lower beyond that exposing the 61.8% expansion at 82.66. The 89.44 level has been recast as near-term resistance, with a break back above that targeting 93.60 anew.

Daily Chart - Created Using FXCM Marketscope 2.0
GOLD – Prices remain range-bound above a falling trend line connecting major swing highs since early November 2011 (1746.79). Near-term resistance is at 1790.55-1802.80 area, with a break above that exposing 1850.00 and the 1900.00 figure. Support is reinforced by the 23.6% Fibonacci retracement at 1737.59, with a push below that targeting the 38.2% and 50% Fibonacci retracements at 1704.25 and 1677.30 respectively.
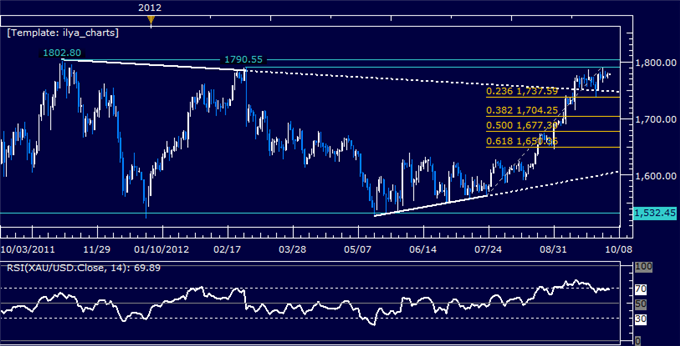
Daily Chart - Created Using FXCM Marketscope 2.0
US DOLLAR – Prices broke through the top of a rising channel set from the September 14 swing low to challenge the 61.8% Fibonacci retracement at 9929. A further break above this boundary targets falling trend line resistance at 9965. The channel top (now at 9909) has been recast as support, with a push back below that eyeing the 50% retracement at 9893.
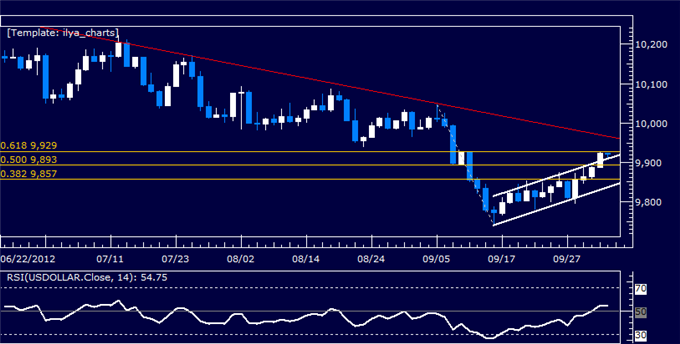
Daily Chart - Created Using FXCM Marketscope 2.0
--- Written by Ilya Spivak, Currency Strategist for Dailyfx.com
To contact Ilya, e-mail ispivak@dailyfx.com. Follow Ilya on Twitter at @IlyaSpivak
To be added to Ilya's e-mail distribution list, send a note with subject line "Distribution List" to ispivak@dailyfx.com
DailyFX provides forex news and technical analysis on the trends that influence the global currency markets.
Learn forex trading with a free practice account and trading charts from FXCM.
