US Dollar, SPX 500 Positioning Still Warning of Reversals
Talking Points
Candle Pattern Hints US Dollar May Rebound from June Low
S&P 500 Shows Possible Reversal Signal at Critical Trend Line
Gold Prices Continue to Tread Water Above $1300/oz Figure
To receive Ilya's analysis directly via email, please SIGN UP HERE
Can’t access to the Dow Jones FXCM US Dollar Index? Try the USD basket on Mirror Trader. **
US DOLLAR TECHNICAL ANALYSIS – Prices put in a bullish Morning Star candlestick pattern above support at 10469, the June swing bottom, hinting a move higher is ahead. Positive RSI divergence bolsters the case for an upside scenario. Initial resistance is at 10536, the 23.6% Fibonacci retracement, with a break above that targeting the 38.2% level at 10591.

Daily Chart - Created Using FXCM Marketscope 2.0
** The Dow Jones FXCM US Dollar Index and the Mirror Trader USD basket are not the same product.
S&P 500 TECHNICAL ANALYSIS – Prices put in a Bullish Engulfing above rising trend line support set from November 2012, hinting a rebound is ahead. Initial resistance is at 1695.50, the 23.6% Fibonacci expansion, with a break above that targeting the 38.2% level at 1711.20. Alternatively, a reversal below the trend line (1672.60) and the 61.8% Fib retracement (1667.70) exposes the 76.4% mark at 1652.00.
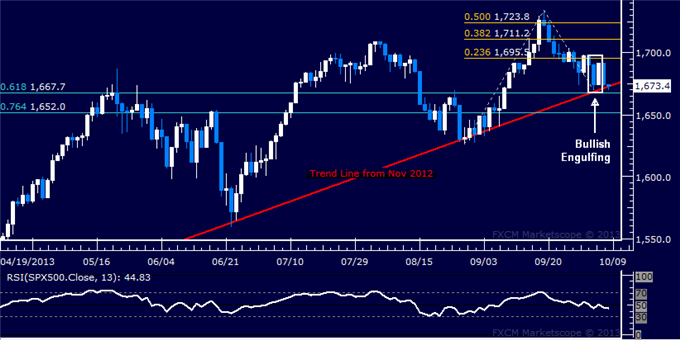
Daily Chart - Created Using FXCM Marketscope 2.0
GOLD TECHNICAL ANALYSIS – Prices continue to hover below resistance at a falling trend line set from late August, now at 1328.39. This barrier is reinforced by the 38.2% Fibonacci retracement at 1337.32, with a break above the latter level targeting the 50% Fib at 1355.70. Horizontal pivot support is at 1275.51.

Daily Chart - Created Using FXCM Marketscope 2.0
CRUDE OIL TECHNICAL ANALYSIS– Prices are wedged between support at 100.88, a horizontal pivot dating back to April 2012, and the underside of a rising channel set from early July (104.90). This is reinforced by the top of a falling channel set from the August 28 swing high. A break upward aims for the underside of a rising trend line set from mid-April (107.24). Alternatively, a push through support initially targets the $100.00/barrel figure.

Daily Chart - Created Using FXCM Marketscope 2.0
--- Written by Ilya Spivak, Currency Strategist for DailyFX.com
Contact and follow Ilya on Twitter: @IlyaSpivak
For live market updates, visit the Real Time News Feed
DailyFX provides forex news and technical analysis on the trends that influence the global currency markets.
Learn forex trading with a free practice account and trading charts from FXCM.
