US Dollar Technical Analysis 02.08.2013
US Dollar Technical Analysis– Prices broke above resistance at 10273, the 100% Fibonacci expansion, exposing10323-30 area marked by the 2012 high and the 123.6% level. The 10273 mark has been recast as near-term support, with a turn back below that targeting the 76.4% Fib at 10216.
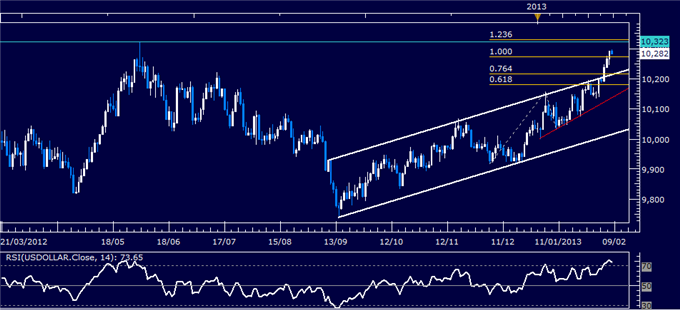
Daily Chart - Created Using FXCM Marketscope 2.0
--- Written by Ilya Spivak, Currency Strategist for Dailyfx.com
To contact Ilya, e-mail ispivak@dailyfx.com. Follow Ilya on Twitter at @IlyaSpivak
To be added to Ilya's e-mail distribution list, please CLICK HERE
New to FX? Watch this Video. For live market updates, visit the Real Time News Feed
DailyFX provides forex news and technical analysis on the trends that influence the global currency markets.
Learn forex trading with a free practice account and trading charts from FXCM.
