US Dollar Technical Analysis – Biggest Drop in a Month Recorded
To receive Ilya's analysis directly via email, please SIGN UP HERE
Talking Points:
US Dollar Technical Strategy: Holding Long via Mirror Trader Basket **
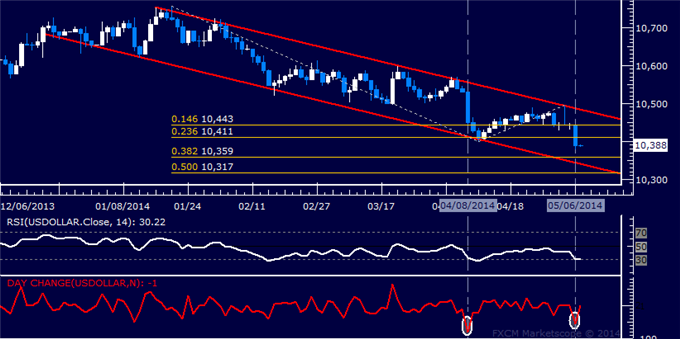
Support: 10359 (38.2% Fib exp.), 10339 (channel floor)
Resistance: 10411 (23.6% Fib ret.), 10443 (14.6% Fib exp.)
The Dow Jones FXCM US Dollar Index issued its largest drop in a month, bringing greenback to the weakest level since October 2013. Sellers now aim to challenge the 38.2% Fibonacci expansion at 10359. A break below this barrier exposes the bottom of a falling channel guiding the down trend since the beginning of the year, now at 10339. Alternatively, a move back above the 23.6% level at 10411 aims for the 14.6% Fib at 10443.
We continue to look for longer-term US Dollar strength in line with our fundamental outlook. As such, we remain long the benchmark currency via theMirror Trader US Dollar currency basket.
Weekly Chart - Created Using FXCM Marketscope 2.0
** The Dow Jones FXCM US Dollar Index and the Mirror Trader USD basket are not the same product.
--- Written by Ilya Spivak, Currency Strategist for DailyFX.com
DailyFX provides forex news and technical analysis on the trends that influence the global currency markets.
Learn forex trading with a free practice account and trading charts from FXCM.
