US DOLLAR Technical Analysis: Is a Weak Dollar Frustrating the Fed?
DailyFX.com -
To See How FXCM’s Live Clients Are Positioned In FX & Equities Click Here Now
Talking Points:
US Dollar Technical Strategy: Declining ATR into Resistance Remains A Worry
US Dollar’s Has Cleared Its Biggest Technical Test of April Highs, Now Onto 12,001
Who Will Win Between Hedge Funds & The Fed on the US Dollar?
The April minutes on Wednesday afternoon provided fuel for the May trend to continue aggressively. After the meeting, the probability of a rate hiked in June jumped to 23% after sitting at less than 5% probability earlier in the week.
Recently, we’ve seen an unusual environment where the Federal Reserve Presidents try to be convincing the market that they’re serious about two rate hikes in 2016. Earlier this week, the probability of a June Rate Increase per Bloomberg sat at a measly 4% probability the first “price-in” hike, not until December.
Today, that number has moved up to as high as 16% and could continue to rise into the June Meeting, which inconveniently lands a little more than a week before the EU Referendum. On Tuesday, Dallas Federal Reserve President Robert Kaplan noted that the EU Referendum would play into the Fed’s decision on rates in June.
Compete to Win Cash Prizes With Your FXCM Mini Account,Click Here For More Info
After, the stalwart showing from the American Consumer last week, we’ve continue to see the US Dollar sit near the highs 8-week highs. The seasonality has favored US Dollar strength, and so far, that appears to be aligning with the May 2015 lift-off in the US Dollar. However, the burden of proof for correct market view currently lays on US Dollar Bulls, which may now include the Fed. The US data will continue to be filtered through the lenses of the recent April FOMC minutes, however, if the data doesn’t pick up significantly, it seems unlike that the Fed would try and shock the market awake with a rate hike just to show they were serious. Especially, as Kaplan noted, ahead of a significant potential risk like ‘Brexit.'
Hedge Funds Still Hate the US Dollar, And That’s Starting To Hurt
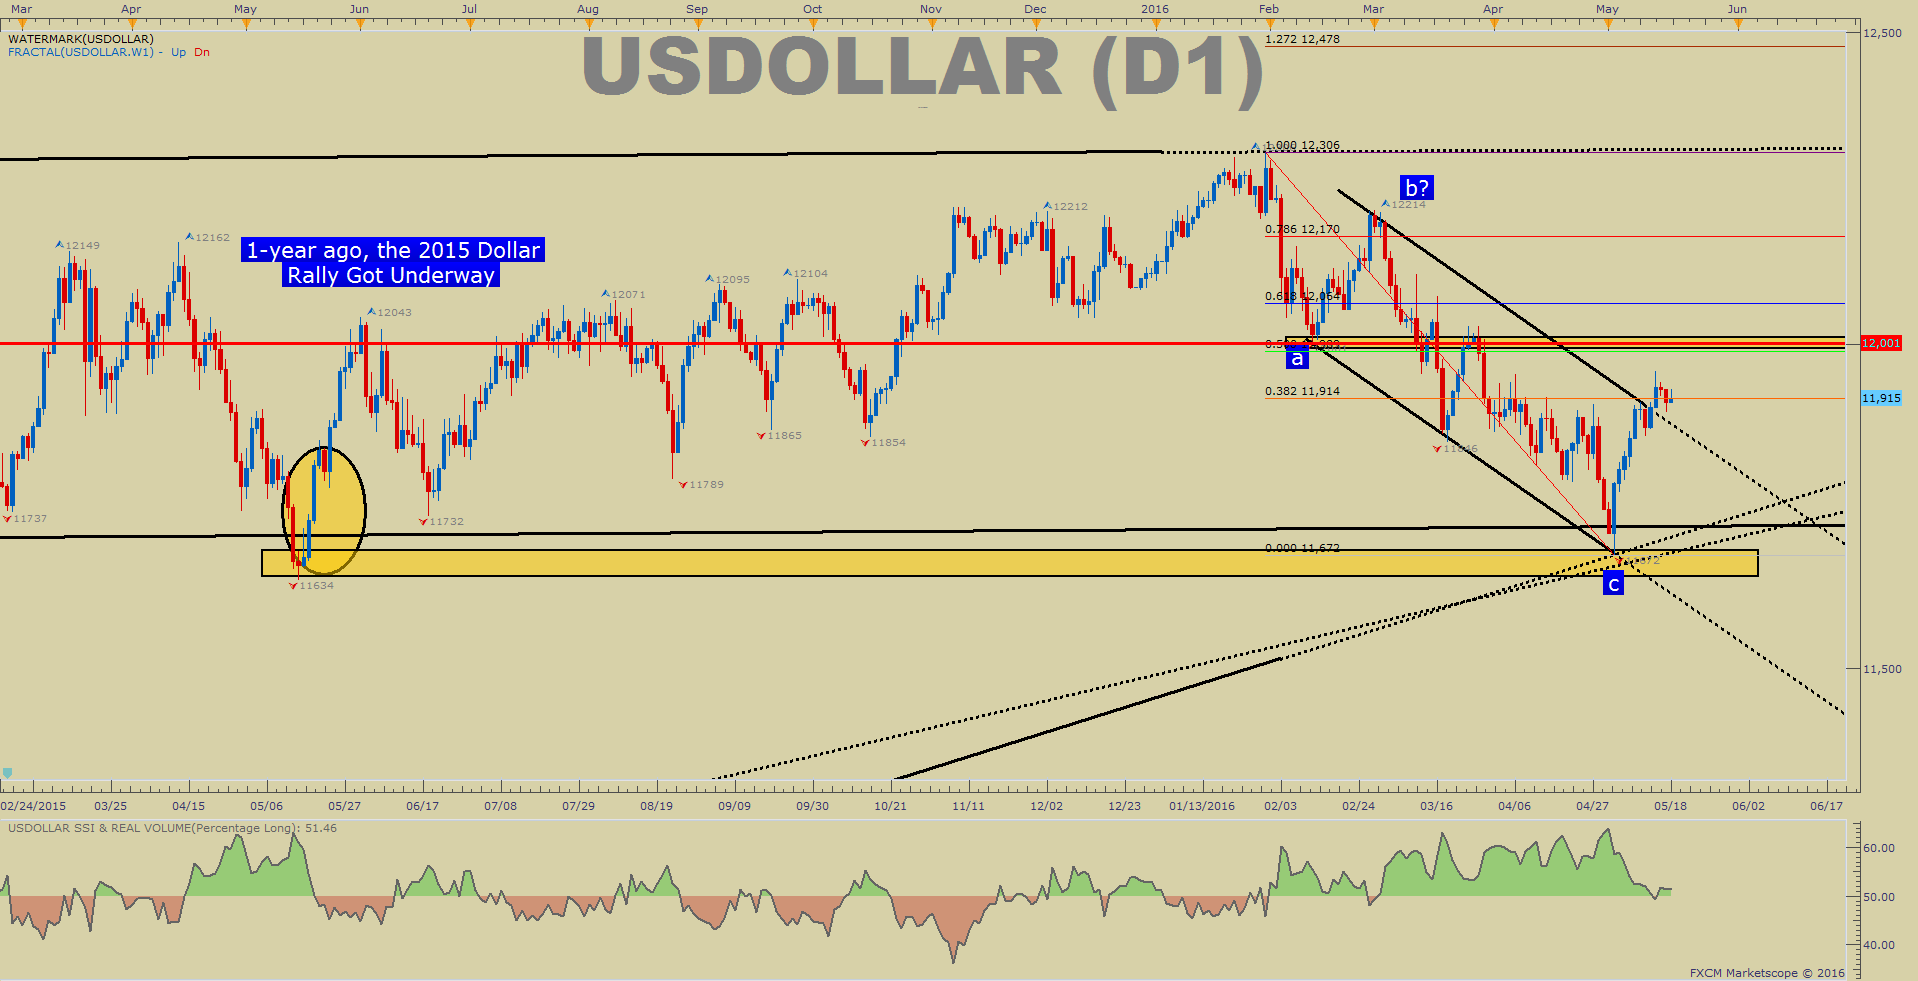
The above chart shows a little over a year’s worth of price data on the US Dollar Index. Earlier, I shared that one of the valuable technical tricks I’ve picked up over the years was to keep an eye on the price range of an extreme day for a potential pivot in price. The bottom rectangle shows the price range for the May 14, 2015, low, with a price range of 11,680/34. Looking to the far right of the chart, you’ll see that we came to that price range while within the corrective channel (red) and then aggressively moved higher by ~2.65% or 309 points on the index.
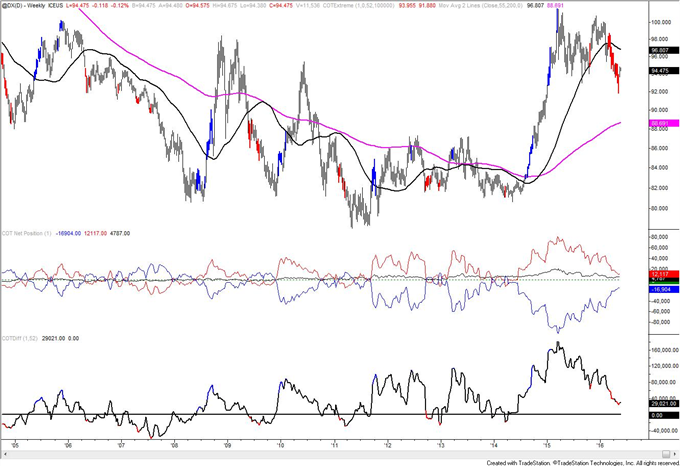
One thing the chart doesn’t show you is that the amount of Dollar bears among hedge funds sit near 52-week lows. To me, this means the breakout risk is high if the Fed continues to rattle their rate-hike stick at the market and hedge funds are forced to cover their short trade by buying. Here’s a helpful chart put together by Jamie Saettele that shows ~10 years of positioning in the US Dollar Futures market (DXY), and the red line on the bottom shows you net positioning by institutional speculators:
Swing US Dollar Chart Favors Focus on April Pivots of 11,953 & 11,907
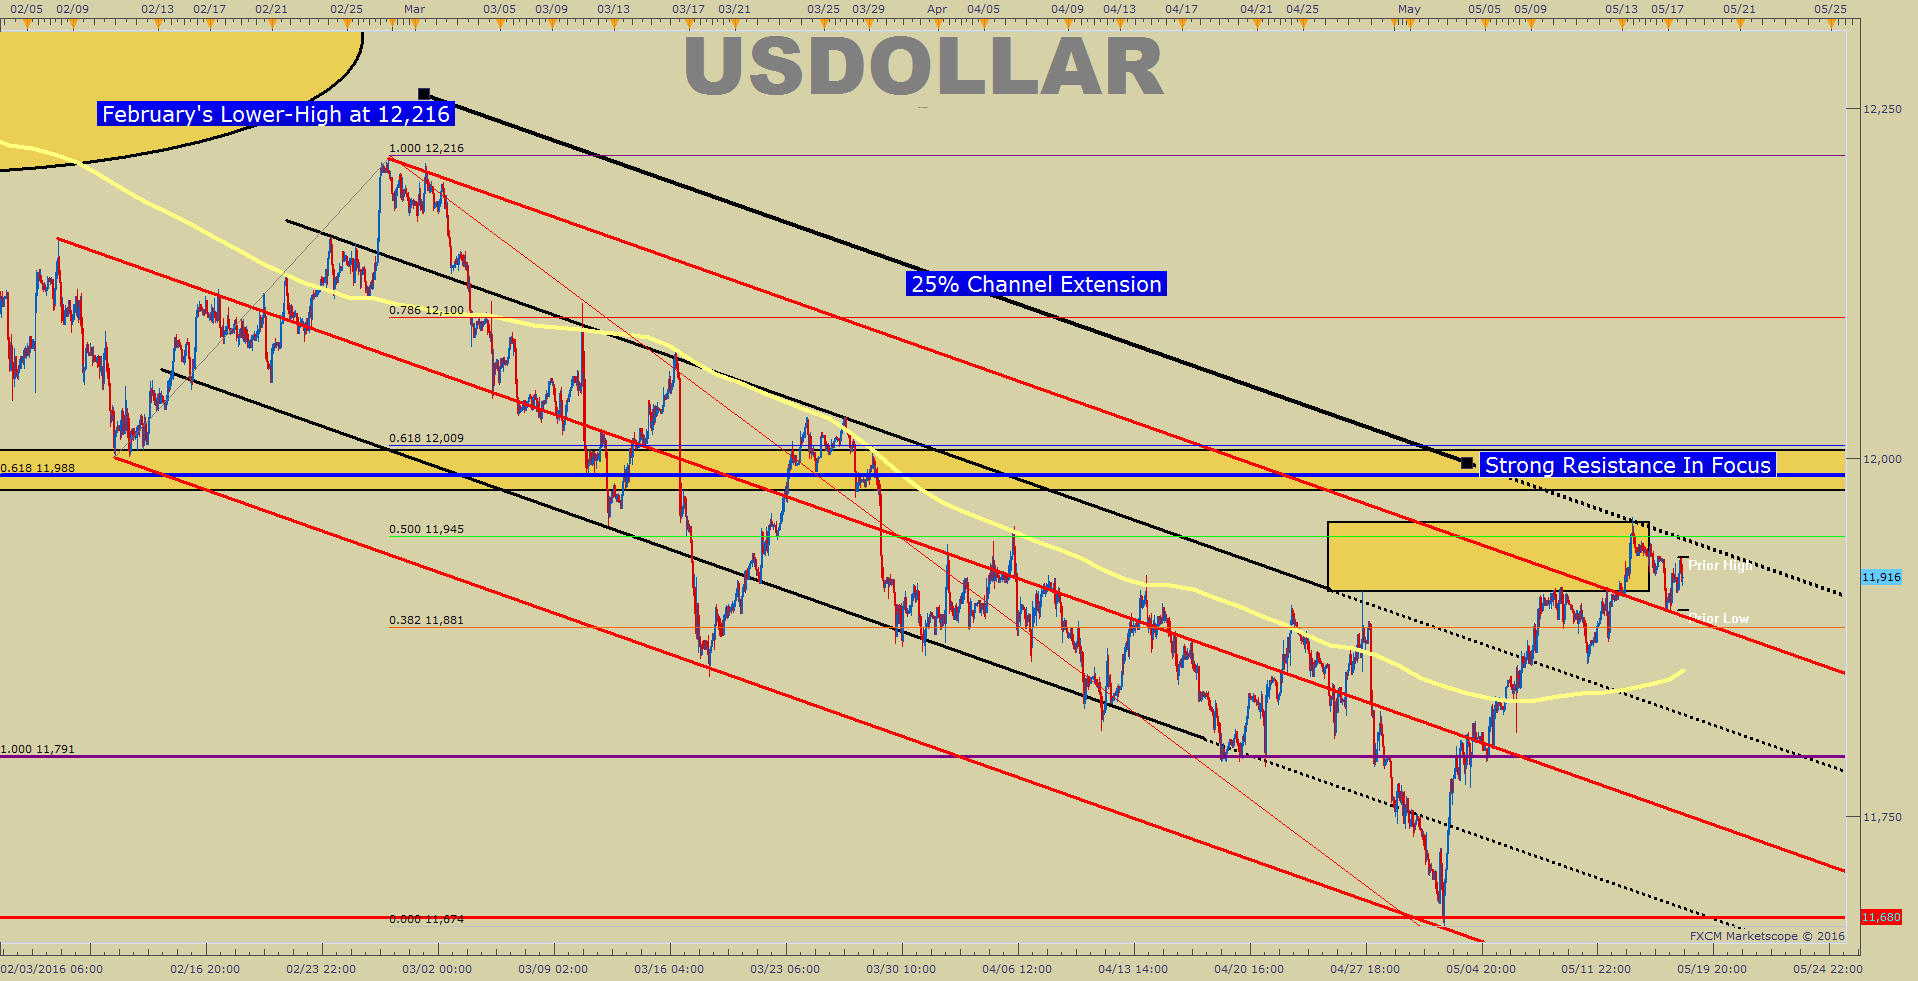
In the chart above, you’ll note that the top line of the bearish channel has been broken. Given the seasonal tendencies, this is undeniably bullish. However, we still sit under important resistance that you should keep on watch.
First, for good measure, I drew a 25% extension sliding parallel off the upper parallel line of the 3-month channel that has held price so well. The sliding parallel sits right below the current monthly high of 11,956 and the 50% retracement of the February-May range at 11,945. The significant resistance that if broken would open the door to new highs is 12,001, which was the February Opening Range low.
Since we’ve now taken out the April highs that we mentioned in the last technical note, support is of less interest to us than resistance as the wind may be at the Bull’s back. ST support is currently the weekly opening range low of 11,893, which was a double-tapped level on Tuesday before pushing higher into the FOMC Minutes release.
Should the weekly low break, there is a confluence of significance at 11,850/55. 11,850 is the 38.2% of the May Range, and should be the first focus of any trend set-back. 11,855 is the May 11 low that was the first setback above the 21-DMA, also near 11,850 that eventually gave way to a 100+ move higher.
The Dollar Is Strong But Pick Your Poison Wisely
The strong move in May that we warned about has shown up in force, and if 2015 is any guide, we could continue in this move for months. However, the index is sitting below important resistance, and until the level of 12,001 breaks, it is hard to take this rally too seriously, yet.
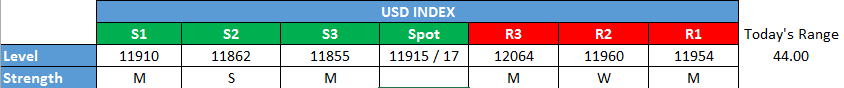
Shorter-Term US Dollar Technical Levels
For those interested in shorter-term levels of focus than the ones above, these levels signal important potential pivot levels over the next 48-hours.
Interested In our Analyst’s Longer-Term Dollar Outlook? Please sign up for our free dollar guide here.
T.Y.
DailyFX provides forex news and technical analysis on the trends that influence the global currency markets.
Learn forex trading with a free practice account and trading charts from FXCM.
