2 Must-See Charts You Need to Check out Before Jumping on Tesla Stock
Shares of Tesla (NASDAQ:TSLA) have been as volatile as ever. Tesla stock plunged to support, rallied hard into resistance and now finds itself again bouncing off support. And that’s just within the last few weeks! The action is concerning to say the least, particularly given the surrounding news flow.

Source: Shutterstock
Tesla recently announced first-quarter deliveries that came up well short of expectations. However, it doesn’t appear to be a demand issue weighing on the name, but rather a logistics one.
The automaker began shipping its Model 3 to Europe and China during the quarter and encountered a few hurdles along the way.
InvestorPlace - Stock Market News, Stock Advice & Trading Tips
This isn’t Apple’s (NASDAQ:AAPL) Tim Cook we’re talking about here, and even this supply chain magician may not have been able to navigate these waters without issue. Tesla deserves a little slack here given this task, although it certainly won’t help the automaker’s financials.
The assumption is that CEO Elon Musk will find (or has found) a solution to the shipping situation and that Q2 deliveries will be much stronger.
That said, it doesn’t help that Musk has found himself in a showdown with the SEC thanks to the CEO’s continued tweeting.
Tesla Issues Continue
But that’s not all. Remember that Tesla also had a $920 million convertible debt payment in the quarter. Tesla could not pay with a mix of cash and stock because its share price did not meet the requirements. As a result, the entire payment had to be in cash.
Finally, Tesla is reportedly looking at making “hundreds of millions” from Fiat Chrysler (NYSE:FCAU). The latter needs to add vehicles to its fleet in order to avoid emissions fines from the EU. This could set up a win-win for the both companies as Fiat looks to avoid these fines and Tesla could really use the cash.
All that said, the recent tone from the analyst community has certainly shifted to a more cautious outlook. Should investors become more cautious too? Let’s look at two important charts.
Short-Term Chart for Tesla Stock
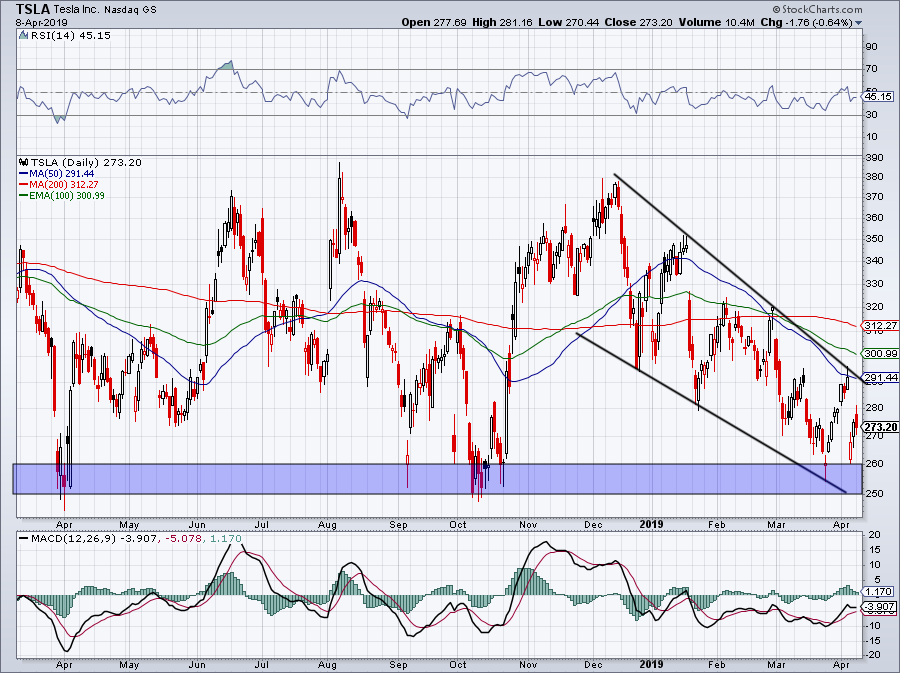
The 50-day moving average and downtrend resistance and working in unison to keep a lid on Tesla stock. Even before the deliveries news, these areas were acting as resistance in the name. That’s why investors should have had more caution going into the report.
Shares fell from resistance to the cusp of long-term support in just one session. However, TSLA quickly rallied $20 a share off those lows before pulling back some.
Now comes the important part, which is why we’ve been watching Tesla so closely lately: Will Tesla stock again challenge downtrend resistance and the 50-day moving average, or will it retest support?
If it pulls back, it’s important for bulls to keep TSLA stock price above this $250 to $260 region. While it has temporarily broke at times, it has not closed below this area over the past year. A look below at the long-term chart will show that TSLA has not closed below this area on a weekly basis in more than two years.
On the upside, TSLA stock can rally to the 100-day and 200-day moving averages should it get through downtrend resistance.
Long-Term Chart for TSLA Stock

On the long-term chart, $250 to $260 support is clear as day. After serving as resistance in 2015 and 2016, TSLA stock has now found this area as support for the last few years. Range resistance has since moved up to the $360 to $380 area.
However, on the weekly chart the 200-week moving average has presented itself as noteworthy support. While Tesla stock has tended to break below this mark for a few weeks at a time over the years, it eventually recovers this mark and bounces higher.
That appears to be the case now too. Or does it?
After initially bouncing, TSLA stock hit downtrend resistance (blue line) and the 10-week moving average. Both have been repelling Tesla all year and as a result, shares are now back below the 200-week moving average.
If the 200-week becomes resistance, then bulls could be in trouble. This could possibly signal a shift in the stock’s long-term trend if that’s the case. It will take some time to play out, but these charts are two to keep handy now.
Bret Kenwell is the manager and author of Future Blue Chips and is on Twitter @BretKenwell. As of this writing, Bret Kenwell is long AAPL.
More From InvestorPlace
The post 2 Must-See Charts You Need to Check out Before Jumping on Tesla Stock appeared first on InvestorPlace.
