2 Real Barriers Facing GBP/CAD Longs
Talking Points:
A Pullback in the Weekly Uptrend
2 Qualities Going Against This Trade
The Key Support Zone for New Longs
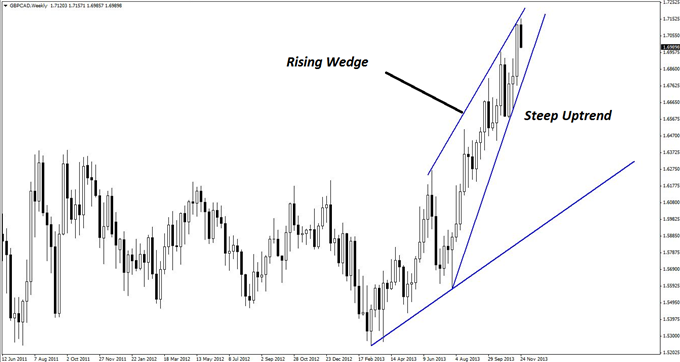
GBPCAD is in a weekly uptrend, as shown on the chart below. Although the rising wedge is an end-of-trend signal, it is quite rare for it to end by tagging the upper trend line perfectly and then breaking down.
Instead, it is far more common for prices to first overshoot the top before staging a turn down. Thus, there may still be room for new long positions at this juncture.
Guest Commentary: Rising Wedge on GBP/CAD Weekly Chart
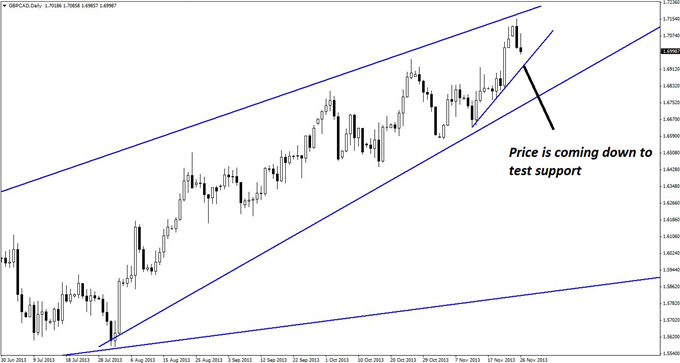
On the daily chart below, there is ample evidence of rising support from a shorter-term trend line, as shown. Price is now headed down to test this level, and although a bounce is possible, there are two key qualities that stand in the way of this trade:
So far, there have only been two daily bearish candles (one is still forming) towards the level of support. It is more common to see at least three develop before a decent bounce
The first bearish candle also completed a bearish engulfing pattern on the daily chart, which is a strong bearish signal
Guest Commentary: 2 Barriers Facing GBP/CAD Longs
On this basis, there is some doubt as to whether this trade has the potential to run very far, but the fact remains that no one knows for certain what the market will do next, so the best a trader can do is to take the trade and manage it accordingly.
If market conditions do become favorable for long positions, this could become a nice running trade as the trend continues. If it does not, however, there is still room to make a small profit on this trade because the level of support is significant.
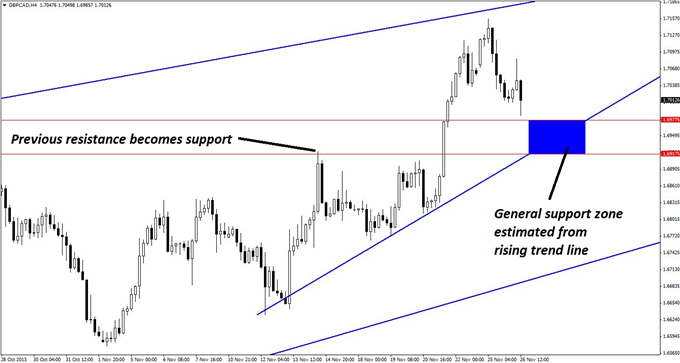
Estimating the zone of support using the four-hour chart below is fairly straightforward. The rising support line provides the general support zone, and the lower level of support terminates at previous resistance. This gives the zone of interest as 1.6917-1.6977.
Guest Commentary: Key Support Zone for GBP/CAD
The time frame for entering this trade would be the hourly (not shown), with reversal divergence, pin bars, and bearish engulfing patterns all being viable triggers.
Although most set-ups are worth at least two or three tries, for the reasons mentioned earlier, this is true of this one in particular. More conservative traders may even decide to skip the first potential entry and only begin taking stabs at it on the second and third entries.
This has pros and cons, of course, with the major drawback being that the first entry may wind up being the right one, and price could take off on its merry way before giving a second entry opportunity.
By Kaye Lee, private fund trader and head trader consultant, StraightTalkTrading.com
DailyFX provides forex news and technical analysis on the trends that influence the global currency markets.
Learn forex trading with a free practice account and trading charts from FXCM.


