The 20 Hardest Places To Sell a Home
The year 2020 was, in many ways, a homebuyer's dream. Mortgage rates hit all-time lows of below 3%, which triggered two phenomena. First, mortgage applications skyrocketed as early as March, as buyers scrambled to lock in lower rates. However, at the same time, this surge in demand drove home prices higher, making the market attractive to sellers.
Read: 32 Insider Tips for Buying and Selling a House
See: The Best Place To Buy a Home in Every State
Unfortunately, all of this occurred during a global pandemic, which made the housing recovery uneven. In some markets, prices shot higher, making it easy for sellers to unload their homes. However, other markets suffered greatly, due to a combination of business closures, population flight, evictions and/or high levels of unemployment.
To help locate housing markets that may be in distress, GOBankingRates analyzed the 95 largest metropolitan housing markets according to Zillow’s Housing Data and found the 20 hardest places to sell a home. Primary factors considered were the difference between list and sale prices, average price cut and average number of days on Zillow.
Find Out: 30 Ways To Upgrade Your Home Without Blowing Your Budget
The resulting list of 20 cities is ranked in reverse order, with the most difficult city in which to sell a home listed last. Depending on your point of view, these cities could represent opportunities for buyers, as sellers that have a tough time getting their list price are likely to drop it. However, if sellers keep dropping their prices in a market, it can start a downward spiral, meaning your home price could fall below what you paid for it. Talking with a good local agent is a good place to start if you're looking to buy and want to get the temperature of a certain area.
Here are the cities in which it's hardest to sell a home.
Last updated: Oct. 26, 2021

20. Ventura, CA
Median list price in 2020: $910,546
Median sale price in 2020: $657,492
Difference between list price and sale price: $253,054
Average number of homes on the market in 2020: 1,646
Median days on market: 16
Percentage of listings with price cut: 12.73%
Median price cut in 2020: 2.17%
Avoid: 30 Things You Do That Can Mess Up Your Credit Score

19. Hartford, CT
Median list price in 2020: $334,606
Median sale price in 2020: $254,705
Difference between list price and sale price: $79,901
Average number of homes on the market in 2020: 4,042
Median days on market: 19
Percentage of listings with price cut: 13.60%
Median price cut in 2020: 3.11%
Look: Common Real Estate Myths That You Need To Know

18. Rochester, NY
Median list price in 2020: $230,645
Median sale price in 2020: $162,100
Difference between list price and sale price: $68,545
Average number of homes on the market in 2020: 2,678
Median days on market: 15
Percentage of listings with price cut: 11.22%
Median price cut in 2020: 3.88%
Don’t Make These Mistakes: Craziest Things That Kill Your Home’s Value

17. Cincinnati, OH
Median list price in 2020: $319,956
Median sale price in 2020: $206,357
Difference between list price and sale price: $113,599
Average number of homes on the market in 2020: 5,773
Median days on market: 7
Percentage of listings with price cut: 16.12%
Median price cut in 2020: 2.89%

16. Buffalo, NY
Median list price in 2020: $205,046
Median sale price in 2020: $172,799
Difference between list price and sale price: $32,246
Average number of homes on the market in 2020: 2,480
Median days on market: 17
Percentage of listings with price cut: 11.93%
Median price cut in 2020: 3.94%

15. Pittsburgh, PA
Median list price in 2020: $199,948
Median sale price in 2020: $181,167
Difference between list price and sale price: $18,781
Average number of homes on the market in 2020: 8,035
Median days on market: 19
Percentage of listings with price cut: 14.96%
Median price cut in 2020: 3.33%

14. Detroit, MI
Median list price in 2020: $264,055
Median sale price in 2020: $208,492
Difference between list price and sale price: $55,563
Average number of homes on the market in 2020: 14,761
Median days on market: 18
Percentage of listings with price cut: 14.65%
Median price cut in 2020: 3.03%

13. Allentown, PA
Median list price in 2020: $271,042
Median sale price in 2020: $213,426
Difference between list price and sale price: $57,615
Average number of homes on the market in 2020: 2,841
Median days on market: 38
Percentage of listings with price cut: 10.42%
Median price cut in 2020: 3.28%

12. Dallas-Fort Worth, TX
Median list price in 2020: $351,506
Median sale price in 2020: $286,034
Difference between list price and sale price: $65,472
Average number of homes on the market in 2020: 30,021
Median days on market: 29
Percentage of listings with price cut: 16.27%
Median price cut in 2020: 1.90%

11. North Port-Sarasota-Bradenton, FL
Median list price in 2020: $382,331
Median sale price in 2020: $297,403
Difference between list price and sale price: $84,929
Average number of homes on the market in 2020: 6,769
Median days on market: 30
Percentage of listings with price cut: 17.24%
Median price cut in 2020: 2.07%

10. Cleveland, OH
Median list price in 2020: $194,789
Median sale price in 2020: $169,192
Difference between list price and sale price: $25,598
Average number of homes on the market in 2020: 7,630
Median days on market: 28
Percentage of listings with price cut: 13.31%
Median price cut in 2020: 3.41%

9. Akron, OH
Median list price in 2020: $171,879
Median sale price in 2020: $160,948
Difference between list price and sale price: $10,931
Average number of homes on the market in 2020: 2,393
Median days on market: 28
Percentage of listings with price cut: 13.94%
Median price cut in 2020: 3.61%
Take a Look: Where People Are Moving During COVID-19: Each State, Ranked

8. McAllen, TX
Median list price in 2020: $216,147
Median sale price in 2020: $166,013
Difference between list price and sale price: $50,134
Average number of homes on the market in 2020: 2,105
Median days on market: 54
Percentage of listings with price cut: 9.82%
Median price cut in 2020: 3.03%

7. Fort Myers, FL
Median list price in 2020: $352,852
Median sale price in 2020: $254,327
Difference between list price and sale price: $98,525
Average number of homes on the market in 2020: 6,812
Median days on market: 42
Percentage of listings with price cut: 16.15%
Median price cut in 2020: 2.03%

6. Houston, TX
Median list price in 2020: $329,958
Median sale price in 2020: $256,304
Difference between list price and sale price: $73,654
Average number of homes on the market in 2020: 34,016
Median days on market: 24
Percentage of listings with price cut: 17.41%
Median price cut in 2020: 2.26%

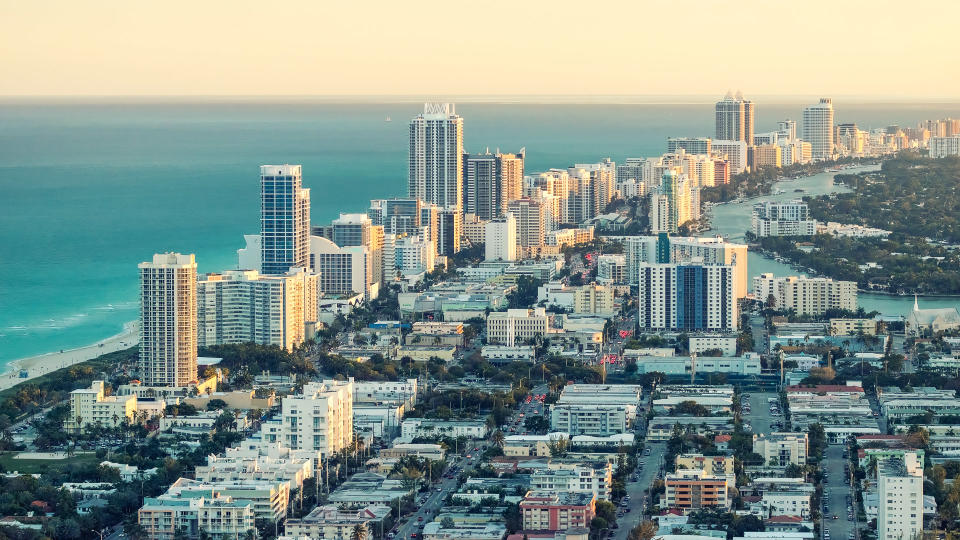
5. Miami-Fort Lauderdale, Florida
Median list price in 2020: $476,379
Median sale price in 2020: $356,243
Difference between list price and sale price: $120,136
Average number of homes on the market in 2020: 26,596
Median days on market: 37
Percentage of listings with price cut: 12.86%
Median price cut in 2020: 2.38%

4. Los Angeles-Long Beach-Anaheim, CA
Median list price in 2020: $1,021,431
Median sale price in 2020: $720,933
Difference between list price and sale price: $300,498
Average number of homes on the market in 2020: 19,469
Median days on market: 16
Percentage of listings with price cut: 11.58%
Median price cut in 2020: 2.50%

3. Chicago, IL
Median list price in 2020: $349,655
Median sale price in 2020: $260,057
Difference between list price and sale price: $89,597
Average number of homes on the market in 2020: 31,570
Median days on market: 24
Percentage of listings with price cut: 18.97%
Median price cut in 2020: 2.26%
Find Out: Key Signs You Should Sell Your Home When You Retire

2. Stamford, CT
Median list price in 2020: $806,333
Median sale price in 2020: $486,629
Difference between list price and sale price: $319,704
Average number of homes on the market in 2020: 4,631
Median days on market: 31
Percentage of listings with price cut: 11.04%
Median price cut in 2020: 3.20%

1. New York, NY
Median list price in 2020: $605,591
Median sale price in 2020: $452,742
Difference between list price and sale price: $152,849
Average number of homes on the market in 2020: 53,853
Median days on market: 45
Percentage of listings with price cut: 10.53%
Median price cut in 2020: 3.01%
More From GOBankingRates
Methodology: GOBankingRates analyzed the 95 largest metropolitan housing markets for which Zillow provides complete data to find the 20 hardest places to sell a home. GOBankingRates first found the 2020 average median list price and 2020 average median sale price for homes in each metropolitan area by averaging Zillow's monthly estimates of each figure for January through November 2020. Then, GOBankingRates calculated the (1) typical difference between the list and sale price for homes in each area in 2020.
GOBankingRates then similarly analyzed Zillow's monthly estimates of other housing market metrics to find each metro area's (2) average housing market inventory in 2020, (3) 2020 average median number of days homes spent on the market, (4) 2020 average share of listings that took a price cut while on the market, and (5) 2020 average median price cut taken by homes on the market, measured as a percent of the prior list price. All cities were then scored against each other and ranked, with a larger difference between list and sale prices, larger housing market inventory, greater typical number of days spent on the market, greater share of listings taking a price cut, and larger price cuts taken indicating places where it is more difficult to sell a home. Zillow's smoothed estimates for single family residences were used for all metrics. In the calculation of final scores, factor (2) was weighted half as heavily as all other factors. All data was compiled on and up to date as of Jan. 7, 2021.
This article originally appeared on GOBankingRates.com: The 20 Hardest Places To Sell a Home
