With A -28.18% Earnings Drop, Is S&P Global Inc’s (NYSE:SPGI) A Concern?

Today I will take a look at S&P Global Inc’s (NYSE:SPGI) most recent earnings update (31 March 2018) and compare these latest figures against its performance over the past few years, as well as how the rest of the capital markets industry performed. As an investor, I find it beneficial to assess SPGI’s trend over the short-to-medium term in order to gauge whether or not the company is able to meet its goals, and ultimately sustainably grow over time. View our latest analysis for S&P Global
Commentary On SPGI’s Past Performance
For the most up-to-date info, I use data from the most recent 12 months, which annualizes the latest 6-month earnings release, or some times, the latest annual report is already the most recent financial data. This technique enables me to analyze different stocks in a uniform manner using new information. For S&P Global, its most recent bottom-line (trailing twelve month) is US$1.59B, which, against last year’s figure, has fallen by -28.18%. Given that these figures may be somewhat nearsighted, I have computed an annualized five-year value for S&P Global’s earnings, which stands at US$936.13M This means even though earnings declined against last year, over the long run, S&P Global’s earnings have been increasing on average.
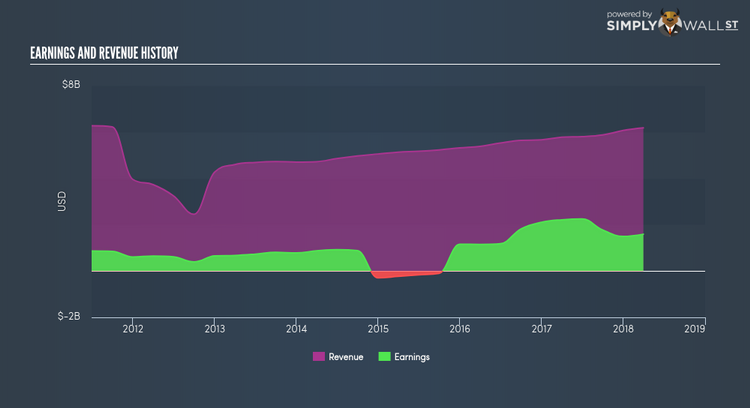
How has it been able to do this? Let’s see if it is merely due to industry tailwinds, or if S&P Global has seen some company-specific growth. In the past couple of years, S&P Global grew its bottom line faster than revenue by effectively controlling its costs. This has caused a margin expansion and profitability over time. Eyeballing growth from a sector-level, the US capital markets industry has been growing its average earnings by double-digit 14.43% in the past twelve months, and 12.82% over the past five years. This means that whatever tailwind the industry is enjoying, S&P Global has not been able to gain as much as its average peer.
What does this mean?
S&P Global’s track record can be a valuable insight into its earnings performance, but it certainly doesn’t tell the whole story. Companies that are profitable, but have unpredictable earnings, can have many factors affecting its business. I recommend you continue to research S&P Global to get a better picture of the stock by looking at:
Future Outlook: What are well-informed industry analysts predicting for SPGI’s future growth? Take a look at our free research report of analyst consensus for SPGI’s outlook.
Financial Health: Is SPGI’s operations financially sustainable? Balance sheets can be hard to analyze, which is why we’ve done it for you. Check out our financial health checks here.
Other High-Performing Stocks: Are there other stocks that provide better prospects with proven track records? Explore our free list of these great stocks here.
NB: Figures in this article are calculated using data from the trailing twelve months from 31 March 2018. This may not be consistent with full year annual report figures.
To help readers see pass the short term volatility of the financial market, we aim to bring you a long-term focused research analysis purely driven by fundamental data. Note that our analysis does not factor in the latest price sensitive company announcements.
The author is an independent contributor and at the time of publication had no position in the stocks mentioned.
