With A 3.0% Return On Equity, Is Top Education Group Ltd (HKG:1752) A Quality Stock?

Many investors are still learning about the various metrics that can be useful when analysing a stock. This article is for those who would like to learn about Return On Equity (ROE). To keep the lesson grounded in practicality, we’ll use ROE to better understand Top Education Group Ltd (HKG:1752).
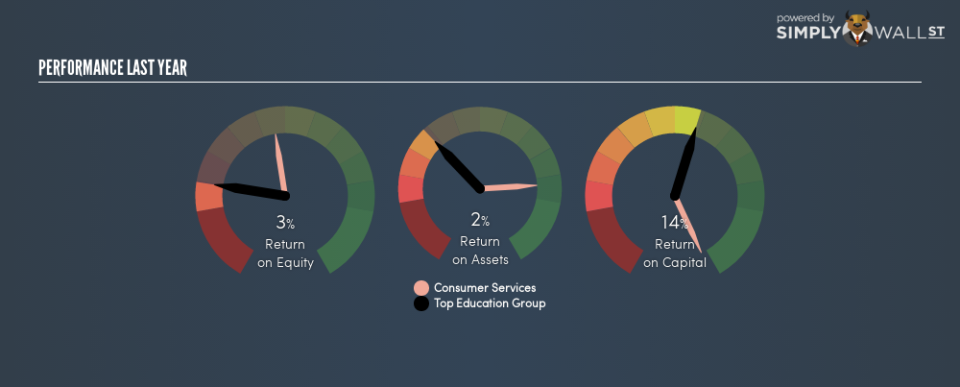
Over the last twelve months Top Education Group has recorded a ROE of 3.0%. That means that for every HK$1 worth of shareholders’ equity, it generated HK$0.030 in profit.
See our latest analysis for Top Education Group
How Do You Calculate Return On Equity?
The formula for ROE is:
Return on Equity = Net Profit ÷ Shareholders’ Equity
Or for Top Education Group:
3.0% = 1.553 ÷ AU$51m (Based on the trailing twelve months to June 2018.)
It’s easy to understand the ‘net profit’ part of that equation, but ‘shareholders’ equity’ requires further explanation. It is all the money paid into the company from shareholders, plus any earnings retained. You can calculate shareholders’ equity by subtracting the company’s total liabilities from its total assets.
What Does Return On Equity Mean?
ROE looks at the amount a company earns relative to the money it has kept within the business. The ‘return’ is the profit over the last twelve months. That means that the higher the ROE, the more profitable the company is. So, as a general rule, a high ROE is a good thing. That means it can be interesting to compare the ROE of different companies.
Does Top Education Group Have A Good Return On Equity?
One simple way to determine if a company has a good return on equity is to compare it to the average for its industry. Importantly, this is far from a perfect measure, because companies differ significantly within the same industry classification. As is clear from the image below, Top Education Group has a lower ROE than the average (15%) in the Consumer Services industry.
That’s not what we like to see. It is better when the ROE is above industry average, but a low one doesn’t necessarily mean the business is overpriced. Nonetheless, it could be useful to double-check if insiders have sold shares recently.
How Does Debt Impact ROE?
Most companies need money — from somewhere — to grow their profits. The cash for investment can come from prior year profits (retained earnings), issuing new shares, or borrowing. In the first two cases, the ROE will capture this use of capital to grow. In the latter case, the debt used for growth will improve returns, but won’t affect the total equity. That will make the ROE look better than if no debt was used.
Combining Top Education Group’s Debt And Its 3.0% Return On Equity
Shareholders will be pleased to learn that Top Education Group has not one iota of net debt! It’s hard to argue its ROE is much good, but the fact that no debt was used is some comfort. At the end of the day, when a company has zero debt, it is in a better position to take future growth opportunities.
The Key Takeaway
Return on equity is a useful indicator of the ability of a business to generate profits and return them to shareholders. Companies that can achieve high returns on equity without too much debt are generally of good quality. If two companies have the same ROE, then I would generally prefer the one with less debt.
But when a business is high quality, the market often bids it up to a price that reflects this. It is important to consider other factors, such as future profit growth — and how much investment is required going forward. So I think it may be worth checking this free report on analyst forecasts for the company.
If you would prefer check out another company — one with potentially superior financials — then do not miss this free list of interesting companies, that have HIGH return on equity and low debt.
To help readers see past the short term volatility of the financial market, we aim to bring you a long-term focused research analysis purely driven by fundamental data. Note that our analysis does not factor in the latest price-sensitive company announcements.
The author is an independent contributor and at the time of publication had no position in the stocks mentioned. For errors that warrant correction please contact the editor at editorial-team@simplywallst.com.
