3 Big Stock Charts for Friday: Netflix, International Paper and Raytheon Company
The market got off to a good start on Thursday, but as the drama of a politically charged senate hearing brewed up, stocks were weighed down. By the time the closing bell rang, what was once a 0.73% gain for the S&P 500 was pared back to only a 0.28% advance.
The market may not have even done that well had it not been for Apple (NASDAQ:AAPL). The world’s biggest and most influential company saw its stock advance 2.1%, following through on a rebound effort that started to take shape earlier in the week. At the other end of the spectrum, Bed Bath & Beyond (NASDAQ:BBBY) led the bearish charge with its 21% tumble in response to a slashed Q2 earnings forecast stemming from newly-imposed tariffs.
Neither are particularly great trading prospects headed into the last trading day of the week. Rather, stock charts of Netflix (NASDAQ:NFLX), International Paper (NYSE:IP) and Raytheon Company (NYSE:RTN) serve up the most compelling possibilities. Here’s why.
InvestorPlace - Stock Market News, Stock Advice & Trading Tips
Netflix (NFLX)

Netflix is a perennial favorite, despite a relatively weak fundamental argument. It’s a reliable enough bullishness, in fact, that hints of new bullishness should be taken seriously as they often precede major rallies.
As unlikely as it seems right now, NFLX just gave traders a subtle but significant clue that a new rally may be underway.
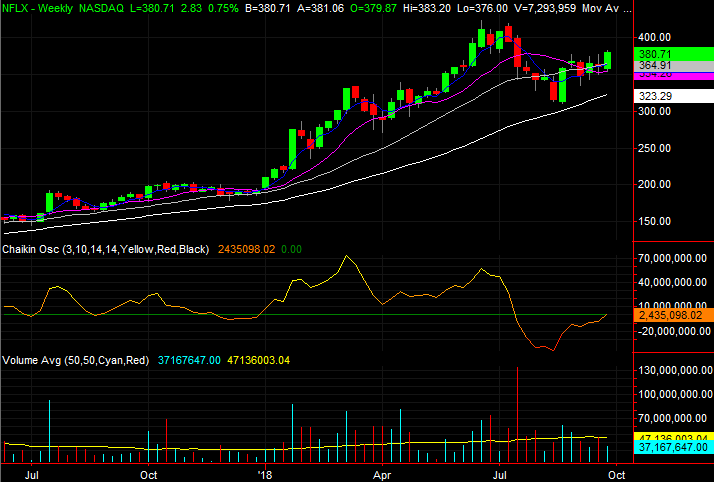
• The trigger is the move above a technical ceiling at $377.34, plotted with a white dashed line. That’s where Netflix peaked a few times since August, but was able to break above that resistance on Wednesday and them followed through on Thursday.
• The rebound from the August low has coincided with a move back above all the key moving average lines. That bullishness was further supported by the establishment of a new, rising support line plotted as a red dashed line.
• Zooming out to a weekly chart of Netlix, this new rally looks an awful lot like the one that materialized in early 2018. NFLX can clearly buck the broad market trend.
International Paper (IP)

If International Paper rings a bell, it may be because it was one of the stock charts featured back on Aug. 16. At the time, IP shares were knocking on the door of a technical floor at $50.00.
That didn’t happen. In fact, we got the exact opposite reaction, with International Paper shares rallying up and off that support in early September. As of Thursday’s close though, IP is back within striking distance of that critical technical floor. And this time, it’s got more than a little bit of bearish momentum.
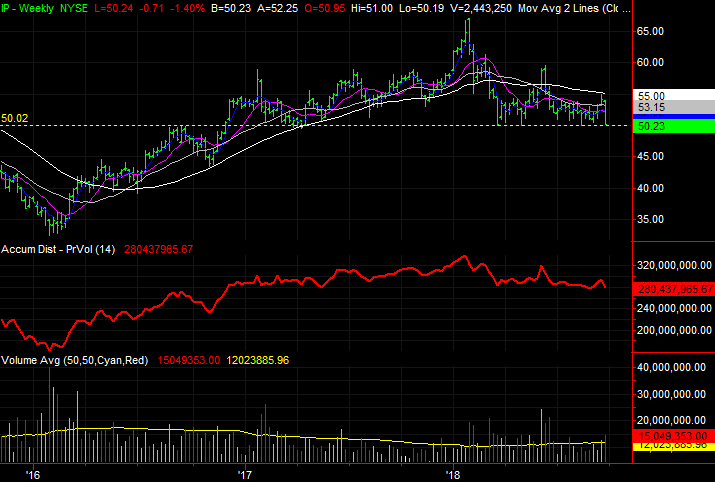
• Notice how much volume has materialized with the pullback starting late last week. The masses clearly, suddenly saw International Paper in a bearish light. That sweeping change is telling in and of itself.
• Backing out to a weekly chart of IP we can see there’s something of a head-and-shoulders pattern quality to the action seen since early last year. Yet, the same view also makes clear there’s no technical support anywhere immediately below $50.00.
• Note that traders are grappling with the value argument. At its current price, IP is priced at a P/E of only 7.0 and a forward-looking P/E of 8.9. That’s cheap by any standard, but not cheap enough for most investors.
Raytheon Company (RTN)

Finally, Raytheon Company shares have been edging higher since July, though not impressively so. There may be more to the slow, methodical advance than there seems to be on the surface. RTN has fought its way above some major technical hurdles, and have since turned many of those resistance levels into support lines.
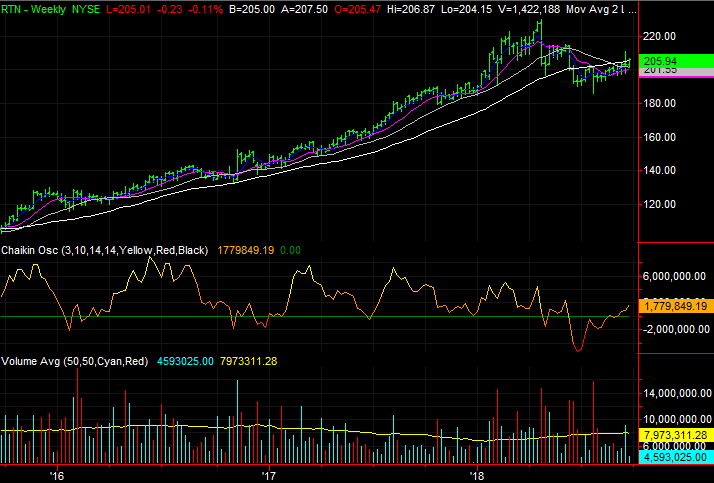
• The pivotal line in the sand is the 200-day moving average line, plotted in white on both stock charts. It’s a line Raytheon struggled to cross above last month, but once it was cleared this month, it did so rather decisively.
• Yes, RTN sold off rather sharply a week ago, but the rebound was just as decisive. That second wind is in many ways even more important than the first cross of the 200-day moving average line, as the bears had their chance to quell the budding rally but were unable to do so.
• Backing out to a weekly chart of Raytheon, we can not only put the early-2018 selloff in perspective, but also frame the rebound effort in the meantime. This long-term look also makes clear what kind of advance is possible; the 2016 and 2017 gains were solid, and healthy, and we may be heading into another such move.
As of this writing, James Brumley did not hold a position in any of the aforementioned securities. You can follow him on Twitter, at @jbrumley.
More From InvestorPlace
The post 3 Big Stock Charts for Friday: Netflix, International Paper and Raytheon Company appeared first on InvestorPlace.
