3 Big Stock Charts for Friday: ConocoPhillips, Caterpillar and Morgan Stanley
Stocks were back and forth all day on Thursday, and by the time the closing bell rang, the game ended in a tie. The S&P 500 only mustered an 0.11 point gain yesterday, which wasn’t even enough to register a percentage change. Underscoring the lack of conviction behind the action is the fact that yesterday’s was the lowest-volume day in months.

Caesars Entertainment
(NASDAQ:CZR) wasn’t fazed by the broad lethargy. Its budding recovery effort was bolstered by whispers that it would soon be putting itself up for sale, sparking a 3.9% advance. At the other end of the spectrum, UnitedHealth Group (NYSE:UNH) fell 4.3% on the heels of growing political uncertainty regarding the future healthcare. Thursday’s jaw-dropper was the 10% tumble Weight Watchers (NASDAQ:WTW), now called WW, took after JPMorgan analyst Christina Brathwaite rang the alarm bells about the company even louder than she had been.
Headed into the week’s final trading session, the stock charts of Morgan Stanley (NYSE:MS), ConocoPhillips (NYSE:COP) and Caterpillar (NYSE:CAT) are worth the closest looks. Here’s why, and what’s about to happen.
InvestorPlace - Stock Market News, Stock Advice & Trading Tips
ConocoPhillips (COP)
Most oil stocks are doing reasonably well, catching a tailwind driven by the rising price of oil. That dynamic, however, hasn’t applied universally. The oil names that aren’t being picked up by that rising tide stand out — and do so for the wrong reason.
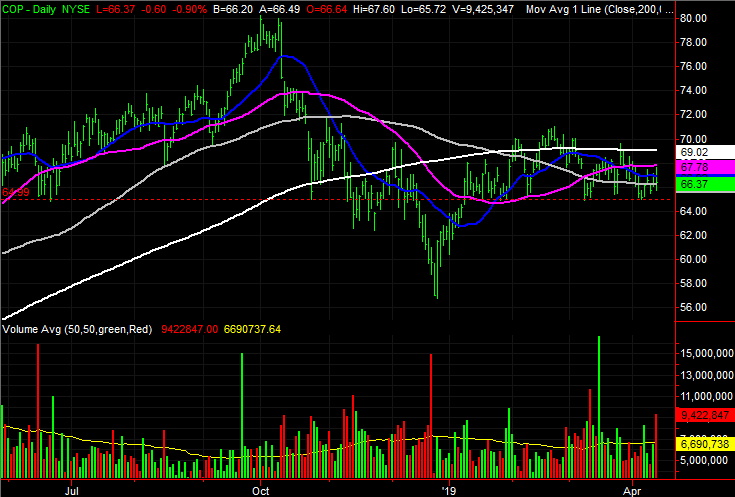
ConocoPhillips is one of those names, and worse, is knocking on the door of a major breakdown. One more poor day could push COP over the edge.
• The line to watch is right at $65, plotted with a red dashed line on the daily chart. That’s where ConocoPhillips has made lows since February, and where it found support before the December drubbing.
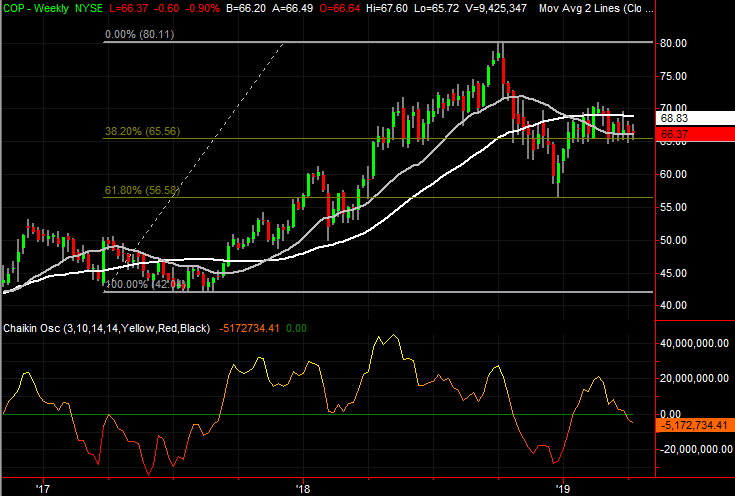
• There may be even more to that technical floor than readily meets the eye. Plotting Fibonacci retracement lines from the well-established floor at $42 from 2017, the $65.60 area is also a key 38.2% Fibonacci retracement line. Notice the other Fibonacci line at $56.60 has also been a key support level.
• It’s subtle, and perhaps means little. But, yesterday’s small pullback took shape on huge volume. There could be a lot of sellers just waiting in the wings for a triggering event.
Caterpillar (CAT)
Last year was a tough one for Caterpillar, and by extension, for CAT shareholders. After a fantastic 2017 that served up promise of a major earnings revival, fears of rising steel prices and a tariff war put Caterpillar shares back in a downtrend. From its January-2018 peak near $173 to October’s low of $112, CAT stock lost a total of 35% from high to low.
Over the course of the past few months, however, we’ve seen hints that the downtrend has been snapped. The new uptrend isn’t fully formed yet, but the lines in the sand are very well defined.
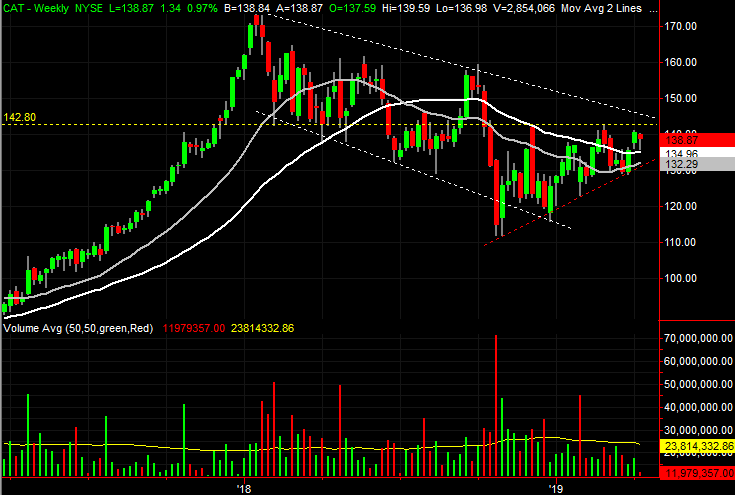
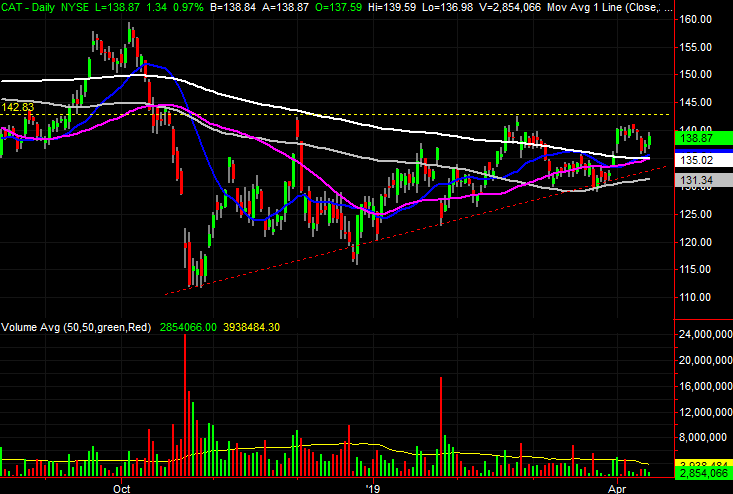
• The key from here is getting above $142.80, where Caterpillar peaked a couple of times since October’s capitulatory low. That resistance level is plotted in yellow on both stock charts.
• At the same time, since October’s bottom, the bulls have managed to form a clear rising support line, plotted in red on both stock charts.
• While a move above $142.80 is still the make-or-break event, the possibility of that happening is bolstered by the golden cross that formed on Thursday. That’s where the purple 50-day moving average line crosses above the white 200-day line.
Morgan Stanley (MS)

When we last looked at Morgan Stanley back on April 5, we were impressed by the breakout thrust that attacked the 200-day moving average line, but were concerned about a gap that had been left behind in the process. It was a perfect setup for the bears to push back.
And they did, as would be expected with any fresh encounter with a major moving average line. It’s what happened in the meantime and what’s about to happen that makes MS worth a refreshed look.

• Morgan Stanley danced with the 200-day moving average line for a day, but slipped back under it. That slide, however, was just enough to almost close the gap that had been left behind on the April 3.
• At the same time, the technical ceiling around $45, marked with a yellow dashed line on both charts, still stands and augments the potential resistance made by the 200-day moving average line.
• Though not yet over that one last hump, if Morgan Stanley shares can clear that line, there’s little left to hold a rally back.
As of this writing, James Brumley did not hold a position in any of the aforementioned securities. You can learn more about James at his site, jamesbrumley.com, or follow him on Twitter, at @jbrumley.
More From InvestorPlace
The post 3 Big Stock Charts for Friday: ConocoPhillips, Caterpillar and Morgan Stanley appeared first on InvestorPlace.
