3 Big Stock Charts for Friday: Wells Fargo, Johnson Controls and Micron Technology
It was touch and go for the better part of yesterday’s action, but as the closing bell approached and hopes for stimulative action took shape, the S&P 500 finished strong. All told, the index gained 0.8% on Thursday, pushing up and off a key technical support level.

Source: Shutterstock
Nvidia (NASDAQ:NVDA) led the way with nearly a 5% advance, as it’s one of the names pegged as the biggest beneficiaries of central bank support for economic growth. General Electric (NYSE:GE) wasn’t far behind with its 2.3% pop, driven by bolstered hope that it will be able to dig its way out of the hole it dug itself into after all … with the market’s help.
At the other end of the scale, Snapchat parent Snap (NYSE:SNAP) fell 3.4% in response to news that rival Instagram launched a “Threads” feature, while shares of booze company Constellation Brands (NYSE:STZ) sank 6% after posting its second-quarter results. Although it topped expectations, investors are increasingly concerned about the adverse impact its failing investment in cannabis company Canopy Growth (NYSE:CGC) is making on the bottom line.
InvestorPlace - Stock Market News, Stock Advice & Trading Tips
Headed into the final trading day of the week, it’s the stock charts of Wells Fargo (NYSE:WFC), Micron Technology (NASDAQ:MU) and Johnson Controls (NYSE:JCI) that have earned the closest looks. Here’s why.
Micron Technology (MU)
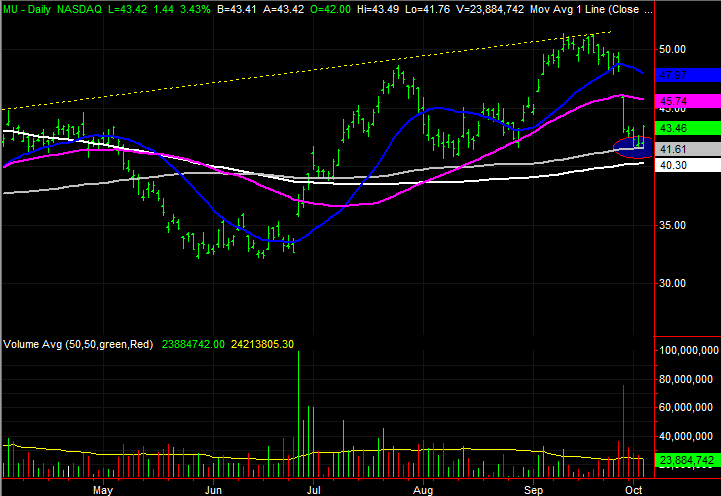
Most stocks logged a gain yesterday, so the fact that Micron Technology shares did the same isn’t terribly remarkable. Yet, there is something especially noteworthy about Thursday’s — and this week’s — action. MU stock found support right where it needed to, and confirmed it’s pushing up and off that critical level. There’s still more to do, but this is an ideal start.
The support level in question is the 100-day moving average line, marked in gray on both stock charts. Notice on the daily chart Micron only had to kiss it one more time on Thursday to launch itself higher.
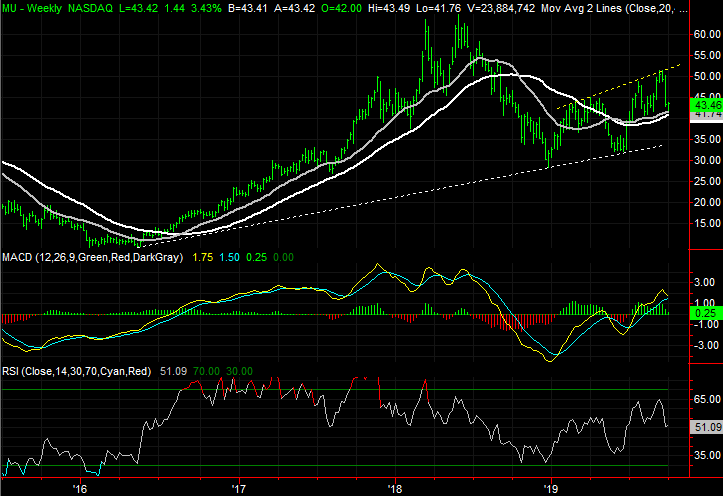
Zooming out to the weekly chart, we can see this recent strength, despite last week’s stumble, is part of a broader uptrend fueled by a rising support line that extends back to the 2016 low.
On both stock charts you’ll also see a yellow dashed line connecting all the highs since April. That proven technical ceiling is likely to come back into play again if this week’s reversal takes hold as expected.
Johnson Controls (JCI)
This year’s turnaround rally from Johnson Controls was impressive to be sure. But, no intellectually honest trader could deny that it has been slowing down the entire time. What is surprising is how abruptly that effort came to a screeching halt between Tuesday and Thursday.
The scope of the plunge (along with Wednesday’s bearish gap) sets the stage for a dead-cat bounce, along with another subtle development. But, it’s more possible — and perhaps even likely — that too much damage has already been done to leave room for a quick rebound.
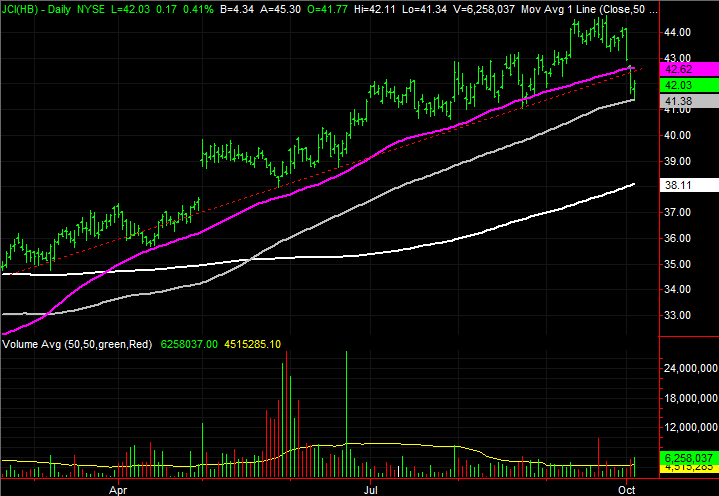
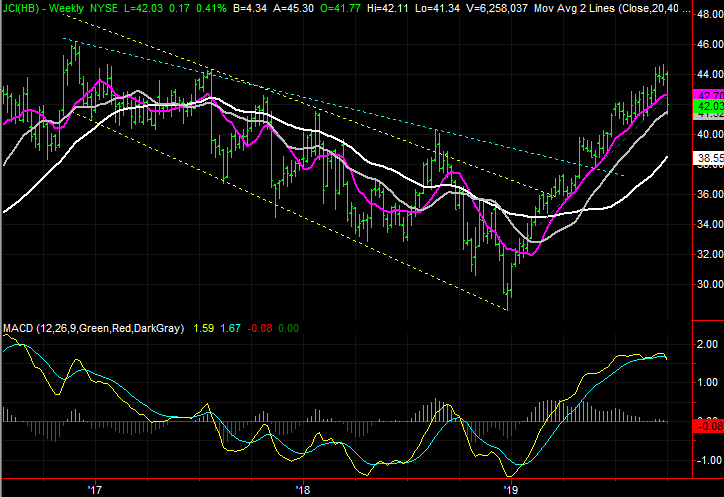
The key breakdown was the move below the rising support line, plotted as a red dashed line on both stock charts, that had kept JCI stock propped up since early this year. The purple 50-day moving average line also played a support role.
The good news is, like many other stocks, Johnson Controls only had to brush its gray 100-day moving average line on Thursday to draw some bargain-hunting buyers back in.
The bad news is, the weekly chart has already dished out a bearish MACD crossunder. It would take a significant bullish jolt to push and keep JCI above the technical floors that were just snapped.
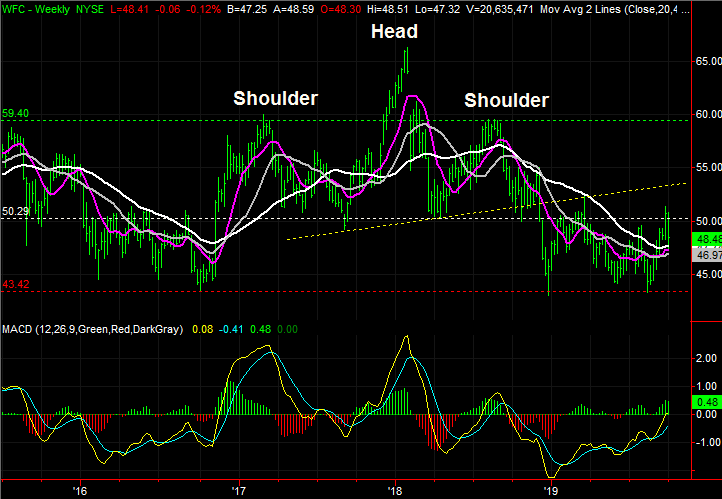
Wells Fargo (WFC)

The last time we looked at Wells Fargo back in late April, shares had recently completed a head and shoulders pattern. In fact, for good measure, WFC stock wasn’t even going to recover without pulling back again from the first rebound effort. The stock has been drifting lower since … until last month. That’s when shares started to form a rebound effort that has gelled nicely in the meantime. Thursday’s bar largely seals the deal; one more catalyst would complete the rebound effort.
Note the shape and placement of yesterday’s intraday reversal. WFC stock only had to touch the purple 50-day moving average line to start the rebound effort.
That same 50-day moving average line is nearing a move above the 200-day moving average line, marked in white on both stock charts. That crossover, called a “golden cross,” is a key buy signal in and of itself.
On the weekly chart, we can see the foundation for the new rally effort is pretty solid. A low of around $43.40, marked with a red dashed line, was made three times since late-2016. The bulls drew a line in the sand there.
As of this writing, James Brumley did not hold a position in any of the aforementioned securities. You can learn more about James at his site, jamesbrumley.com, or follow him on Twitter, at @jbrumley.
More From InvestorPlace
The post 3 Big Stock Charts for Friday: Wells Fargo, Johnson Controls and Micron Technology appeared first on InvestorPlace.
