3 Big Stock Charts for Friday: Nvidia Corporation, Intel Corporation and Facebook, Inc.
Traders have watched the market turn in a split performance through much of November and December as the technology-heavy indices have performed poorly against the backdrop of the broader S&P 500 index. The underperformance of technology has some concerned, but its actually a seasonal trend that most aren’t aware of.
Over the last 20 years, the PowerShares QQQ Trust, Series 1 (ETF) (NASDAQ:QQQ) has only outperformed the Dow Jones Industrial Average 30% of the time. This indicates that the year-end seasonality often includes a tech selloff, most likely due to portfolio managers locking-in gains before the year-end statements go out.
That said, this selling is usually temporary as the QQQ shares and other technology-based indices and ETFs post stronger average historical performance in December and January. This indicates that a seasonal buying opportunity exists in the tech sector, right now!
InvestorPlace - Stock Market News, Stock Advice & Trading Tips
Today’s Three Big Stock Charts looks at three tech companies that are likely to pick up the performance as the New Year gets rolling. Shares of Nvidia Corporation (NASDAQ:NVDA), Intel Corporation (NASDAQ:INTC) and Facebook, Inc. (NASDAQ: FB) are set to follow the Nasdaq 100’s seasonal comeback strength.
Nvidia Corporation (NVDA)
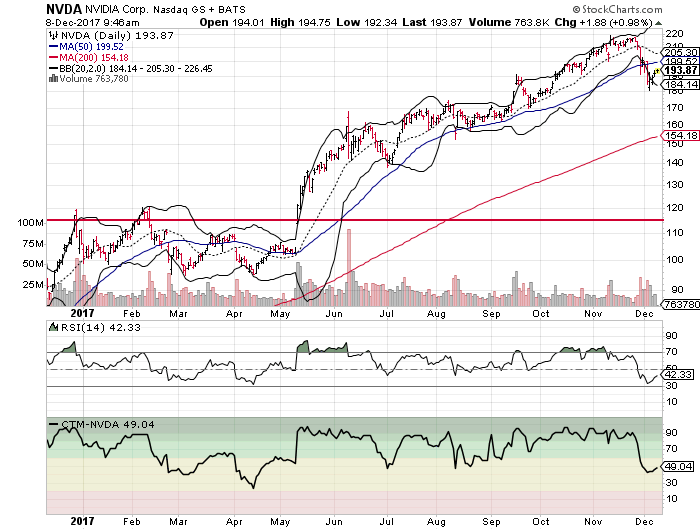
The semiconductor juggernaut has been targeted by profit-taking over the last month or so, and understandably. Nvidia shares traded 105% higher during 2017 when it hit its highs in early November. Now, NVDA stock is set for a potential comeback.
Nvidia has sold off by more than 17% to its recent lows, turning in what most technicians would refer to as a healthy correction. These often clear the way for new traders to step in and buy NVDA stock on this dip.
Shares of Nvidia have hit an oversold reading of their RSI recently for the first time since April. The April selloff reading front-ran the strong 2017 rally that NVDA shares were able to post.
The 50-day moving average for Nvidia is sitting at $200 and still trending higher. NVDA stock is likely to see some resistance as it tries to cross above this mark, but a move above the 50-day will trigger a whole new round of buying in it.
Seasonally, NVDA posts gains 68% of the time in December over the last 20 years. We expect this seasonality trend to continue in 2018.
Intel Corporation (INTC)
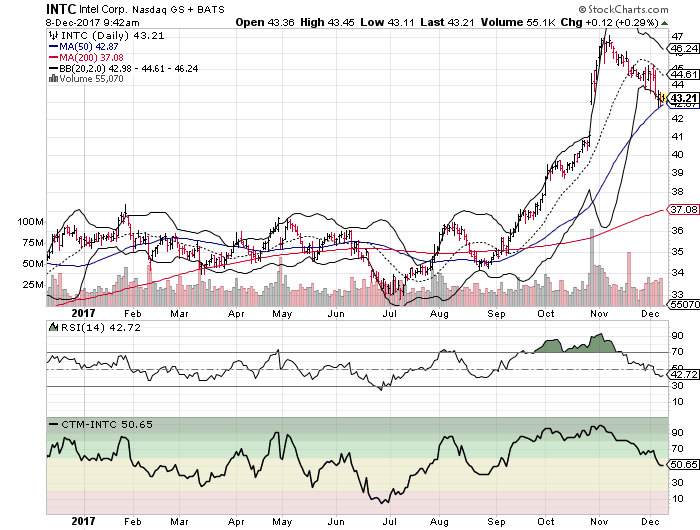
Another semiconductor company that has seen profit-taking in November and December is Intel. The semiconductor giant moved to extremely overbought trading conditions after its last earnings report drove INTC stock to $47.
Now trading at $43, Intel is ripe for a “buy the dip” trade.
We’ve seen INTC shares trade in a tight consolidation range for the last week above the round-number $43 price. While this has happened, volume has been on the rise, indicating that the stock is gaining traction and buyers.
The Chande Trend Meter dipped into “neutral” territory this week, but it is turning higher and preparing to turn bullish again. This indicates that momentum is already improving and likely to turn the stock higher.
The 50-day moving average for INTC is trading right at the $43-level, strengthening the potential for a buying rally from here. This trendline is moving higher, which indicates a bullish outlook for the stock as the New Year opens for trading in a few weeks.
Facebook, Inc. (FB)
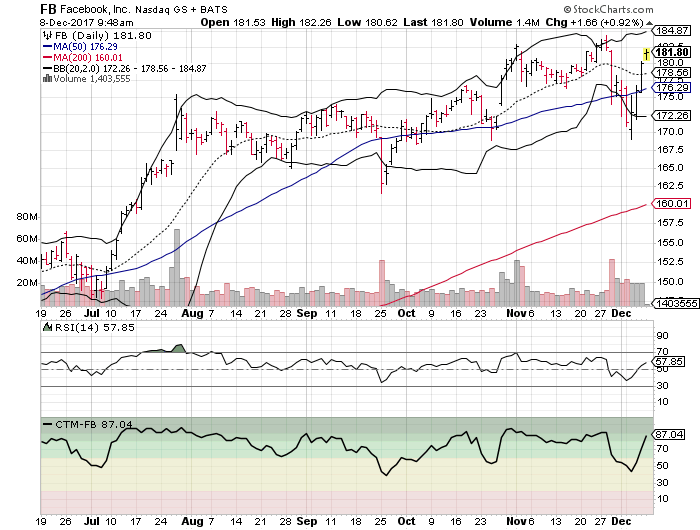
Fabebook is another tech giant that has been pulled down by year-end profit-taking. FB stock dropped from $184.25 to $169 offering traders an opportunity to jump into the shares at roughly a 9% discount.
They took the opportunity and shares are already heading higher, but it’s not too late.
The Chande Trend Meter just moved back into bullish territory as FB stock bottomed at $169. This indicates that we should see a momentum move that takes out the old highs and moves Facebook towards the $200-mark in January.
From a seasonality perspective, FB has traded higher 80% of the time in January since its IPO for an average gain of 9.7%. This seasonality is likely to continue as the stock breaks back into new-high territory.
Yesterday’s rally moves Facebook back above its 50-day moving average again. The 50-day for FB is trending higher, indicating that the stock is ready to hit the seasonally strong January with a strong intermediate bullish outlook as a positive tailwind.
As of this writing, Johnson Research Group did not hold a position in any of the aforementioned securities.
More From InvestorPlace
The post 3 Big Stock Charts for Friday: Nvidia Corporation, Intel Corporation and Facebook, Inc. appeared first on InvestorPlace.
