3 Big Stock Charts for Monday: Walt Disney, Tyson Foods and Keysight Technologies
Stocks may not have gotten Friday’s action off on the most bullish foot, with fears that Thursday’s loss may be the shape of things to come. As the closing bell approached, though, investors decided the bigger risk was not being in stocks headed into the weekend. The S&P 500 managed to advance 0.64% on the last day of last week.

As for winners and losers, Friday was a game of extremes. Kraft Heinz (NASDAQ:KHC) fell 27.5% on news of a huge write-down and a dividend cut, while Wayfair (NYSE:W) rallied 27.9% after posting an earnings report that indicated surprisingly strong revenue growth in its fourth quarter. The two were hardly the only unusually big movers though. Roku (NASDAQ:ROKU) was up over 25% in response to an improved 2019 outlook. Stamps.com (NASDAQ:STMP) was off 57% following news that its official relationship with the U.S. post office had been severed.
That level of volatility mostly disqualifies any of these names as trade prospects, as price jolts lead to unpredictable responses. Rather, it’s stock charts of Walt Disney (NYSE:DIS), Tyson Foods (NYSE:TSN) and Keysight Technologies (NYSE:KEYS) that are shaping up as the best trading best.
InvestorPlace - Stock Market News, Stock Advice & Trading Tips
Keysight Technologies (KEYS)

Keysight Technologies shares may have ended Friday’s action with another market-beating gain, but the already overbought stock also dropped a big hint that the last of the buying effort has just been exhausted.
A loss sometime early this week will confirm Friday was a pivot out of an uptrend and into a downtrend.
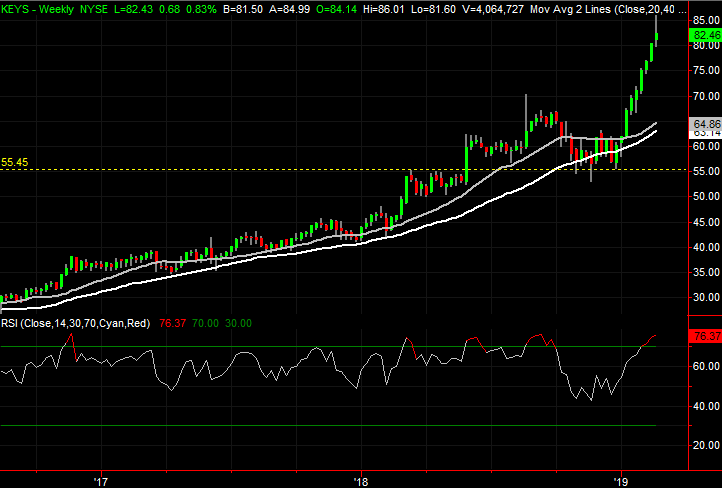
• The shape of Friday’s bar is a big hint. Though higher on a closing basis, Friday’s close was well below the high after a prolonged rally, suggesting the profit-takers are finally started to crawl out of the woodwork.
• The volume surge is also a key clue that the last of the buyers were pouring in at the same time the first of the sellers started to file out.
• Should the sellers take charge, the lowest plausible downside target is around $56, which was a floor in the latter part of last year but a ceiling earlier in 2018.
Walt Disney (DIS)

With nothing more than a quick glance, Walt Disney shares look volatile, but unproductive. When one zooms out to the weekly chart of DIS stock, however, it becomes clear the recent action is actually far more productive and telling. The stock has renewed a bullish break out of a converging wedge pattern that was first hurdled in July. It would just take one more drubbing to fully go through the capitulation process.
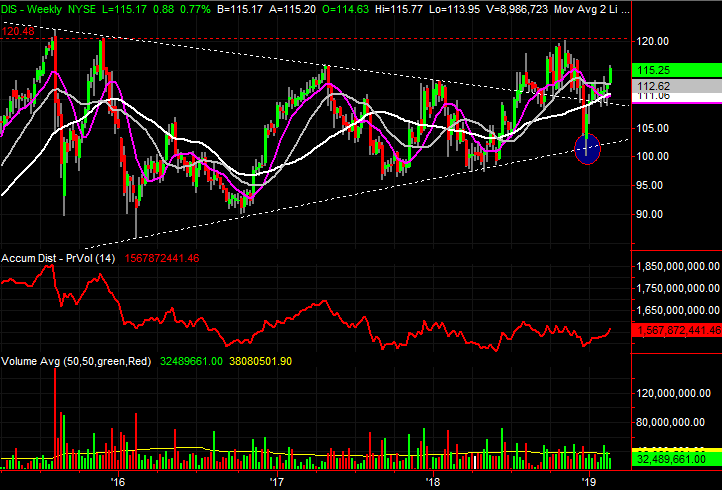
• The converging wedge pattern is only evident on the weekly chart, where it’s framed with white dashed lines. Overcoming the December rout, DIS is back above the upper edge of that zone now.
• The December plunge was more calculated and beneficial than it seems. Traders wanted to verify the lower boundary of that wedge one last time before completing the capitulation process.
• While the undertow is bullish, notice the horizontal resistance around $120.50, marked with a red dashed line. That level has kept Walt Disney shares capped since late 2015.
Tyson Foods (TSN)

It’s not over its final hump just yet, but one more good lurch forward could push Tyson Foods all the way onto a path that starts to unwind last year’s oversized loss. In fact, the ceiling dead ahead is a much bigger deal than most traders might realize.
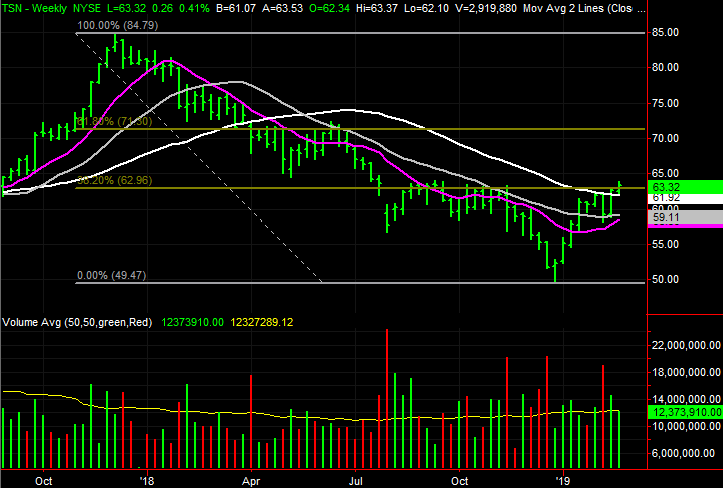
• The big bullish signal here is the recent cross above the white 200-day moving average line, though that clue wasn’t hardened until TSN shares fell back to that line on Friday and ended up pushing off of it again.
• Still, both the $63.35 area marked in blue and the $64 level marked with yellow have re-proven themselves as technical resistance. Both are coming back into play now, and Tyson will need to clear both before the bills pile on in earnest.
• The current indecision is not terribly surprising, given the $62.80 level marks a major Fibonacci retracement line base on the span between the late-2017 high and the late 2018 low. A decisive move past that mark paves the way for a move to the next Fibonacci line around $71, which was resistance for a short while in the middle of last year.
As of this writing, James Brumley did not hold a position in any of the aforementioned securities. You can learn more about James at his site, jamesbrumley.com, or follow him on Twitter, at @jbrumley.
More From InvestorPlace
The post 3 Big Stock Charts for Monday: Walt Disney, Tyson Foods and Keysight Technologies appeared first on InvestorPlace.
