3 Big Stock Charts for Monday: Caterpillar, Lamb Weston and CF Industries
Given its modestly poor performance on Tuesday and Wednesday, the odds were against a gain on Thursday headed into the long weekend. But the S&P 500 defied the odds, clawing its way back out of the red to leave behind a 0.16% gain. It’s clear, however, the weight of the gains since late December aren’t going to be easy to shrug off.

Source: Allan Ajifo via Wikimedia (Modified)
Investors can thank General Electric (NYSE:GE) for doing a great deal of the heavy lifting. Shares of the struggling industrial giant were up 2.5% after Melius Research analyst Scott Davis claimed a top industrial investor is stepping into the beaten-down stock.
At the other end of the spectrum, Pfizer (NYSE:PFE) fell 1.5%, extending a sector-wide selloff that largely stems from an uncertain future for healthcare. Most Democratic Presidential candidates are developing a platform on government-managed healthcare, while Republicans aren’t offering much in the way of alternatives.
InvestorPlace - Stock Market News, Stock Advice & Trading Tips
Neither of those names is a particularly great trading prospect as the new trading week kicks off though. Rather, take a look at the stock charts of CF Industries Holdings (NYSE:CF), Caterpillar (NYSE:CAT) and Lamb Weston Holdings (NYSE:LW) for your best bets.
Caterpillar (CAT)
Caterpillar shares have been losing ground since early 2018. Although 2017 was almost heroic, fear of tariffs followed by the actual implementation of those tariffs took a sizeable toll on CAT stock.
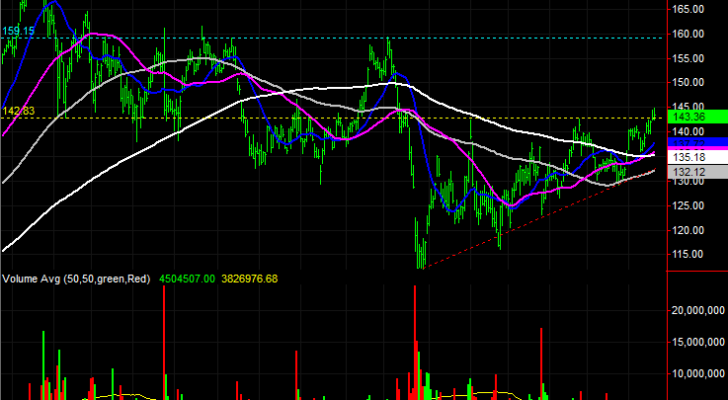
Things have changed since October’s low though. We’ve seen a string of higher lows, and as of the end of last week, higher highs. There’s just one more hurdle to clear before Caterpillar stock is in full-blown breakout mode.
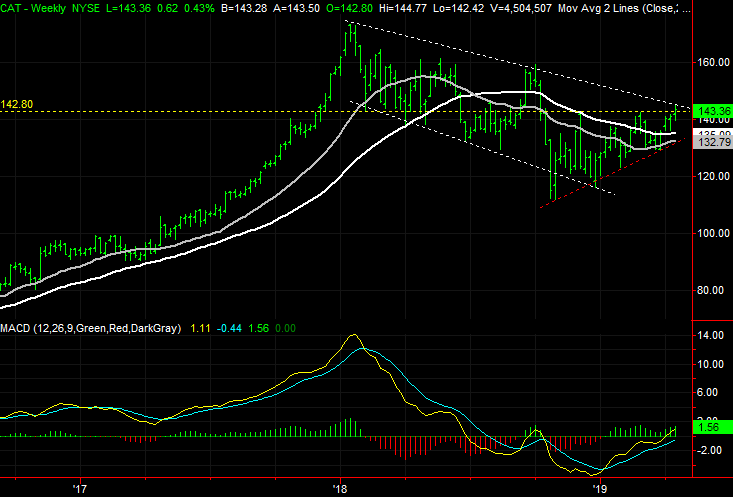
The breakout trigger would be a thrust above the upper edge of the falling trading range plotted in white on the weekly chart. One or two more good days could get the stock past that ceiling.
In the meantime, CAT stock has cleared a horizontal ceiling at $142.83, plotted with a yellow dashed line on both stock charts. Shares hit highs there a couple of times before pushing above that resistance last week.
If the breakout takes hold, the most plausible upside target is around $159, where CAT peaked several times in the middle of last year. That level is marked with a dashed blue line on the daily chart.
Lamb Weston Holdings (LW)
You may be more familiar with Lamb Weston Holdings than you realize. The company supplies potato products to the restaurant industry. Restaurants sell 80 million servings of Lamb Weston-supplied fries every single day. It may also be unfamiliar simply because it has only been a publicly traded entity since late 2016, when it was spun off by ConAgra Foods (NYSE:CAG).
LW stock had a pretty good post-spinoff run too. As of last week though, it’s pretty clear the post-spinoff euphoria has run its course. LW stock is one bad day away from a major meltdown.

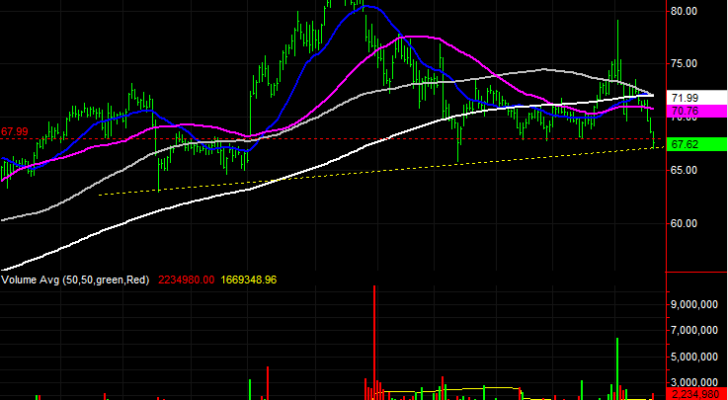
Thursday’s low lines up with the last two major lows, plotted with a yellow dashed line on both stock charts.
Although the intermediate-term support is still intact, the horizontal support at $68.00, where Lamb Weston stock found a floor a few times in February and March, failed as a floor on Thursday.
It’s subtle and not yet convincing, but Friday’s bearish volume in LW stock was above average. It’s a hint that there may be a lot more nervous investors waiting in the wings to dump their stake should things get any worse.
CF Industries Holdings (CF)

A month ago, CF stock was close to a breaking point. It was moving back toward a low around $89 for a second time after falling to that level in early March, with some momentum behind the effort.
The stock never slipped over the edge though. Rather, it pushed up and off that floor at $89 to make a double bottom. Now shares are within striking distance of a couple of different technical ceilings that could prove quite catalytic.
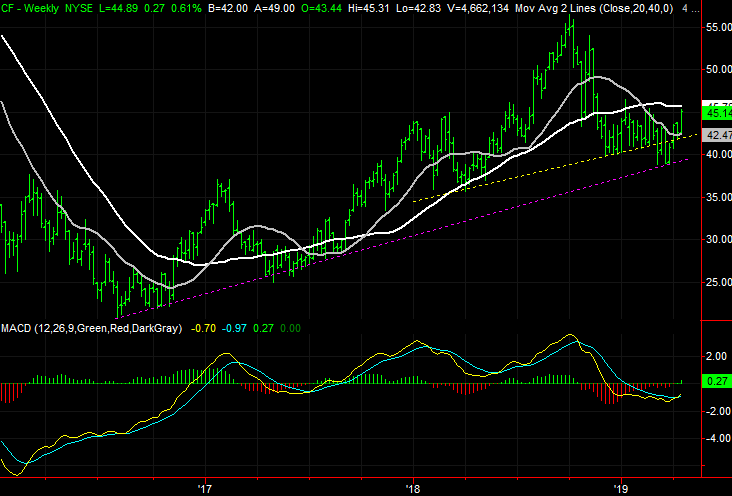
The first of those technical ceilings is $45.40, marked with a red dashed line. That’s where shares peaked in February, and so far where they’ve peaked in April.
Bolstering the bullish case is the amount of buying volume that materialized the last two days of last week. There are willing buyers out there.
Further bolstering the bullish case is the way CF stock found support at a well-established support line plotted in purple on the weekly chart. It has tagged all the key lows going back to late 2016.
At this point, the make-or-break line is the 200-day moving average line, plotted in white on both stock charts.
As of this writing, James Brumley did not hold a position in any of the aforementioned securities. You can learn more about James at his site, jamesbrumley.com, or follow him on Twitter, at @jbrumley.
More From InvestorPlace
The post 3 Big Stock Charts for Monday: Caterpillar, Lamb Weston and CF Industries appeared first on InvestorPlace.
