3 Big Stock Charts for Monday: Amazon, Activision Blizzard and Jack Henry & Associates
Investors weren’t so sure they could trust the market on Thursday, following Wednesday’s breakdown in response to recession worries. They forgot about those doubts by Friday though, with the S&P 500 rallying 1.44% to finish the week on a high note.

Source: Shutterstock
General Electric (NYSE:GE) led the charge, rallying nearly 10% after plunging on Thursday in response to accusations that its books understated the full extent of its insurance liabilities. Advanced Micro Devices (NASDAQ:AMD) had a big day as well though, gaining 5% buoyed by rebounding rival Nvidia (NASDAQ:NVDA).
Not every name was a winner on Friday though. Palo Alto Networks (NYSE:PANW), for instance, fell more than 7% on more management changes that may or may not help, but will certainly prove disruptive.
InvestorPlace - Stock Market News, Stock Advice & Trading Tips
As the new trading week gets going though, it’s the stock charts of Activision Blizzard (NASDAQ:ATVI), Jack Henry & Associates (NASDAQ:JKHY) and Amazon (NASDAQ:AMZN) that merit a closer look. Here’s why.
Amazon (AMZN)
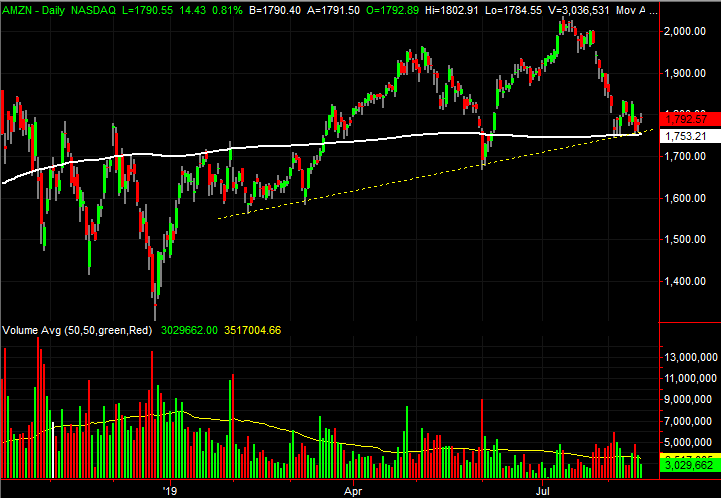
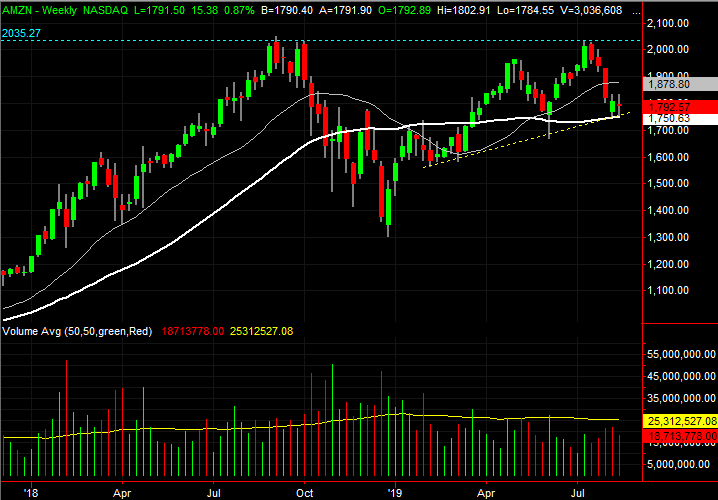
In early July, Amazon looked unstoppable. It had just rekindled a recovery effort that began in January, pushing up and off a support liner that started to take shape in February. That move jolted AMZN back above a key moving average line as well.
As was the case in May, the advance fell apart once it got overextended, falling back just as much. This time, however, the selloff stopped exactly where it needed to. Better still, where the selling stopped is precisely where a renewed rally effort would materialize.
Two floors have converged, and AMZN is finding support at both of them. One is the straight-line support plotted in yellow on both stock charts. The other is the 200-day moving average line, in white.
If the prospective bounce takes hold, it will still have to contend with proven technical resistance around $2,035, marked with a light blue line on the weekly chart.
While primed for a turnaround, the bullish days that have kept Amazon shares above the 200-day moving average line have been on thin volume. There’s not a lot of evidence of strong bullish sentiment here.
Jack Henry & Associates (JKHY)
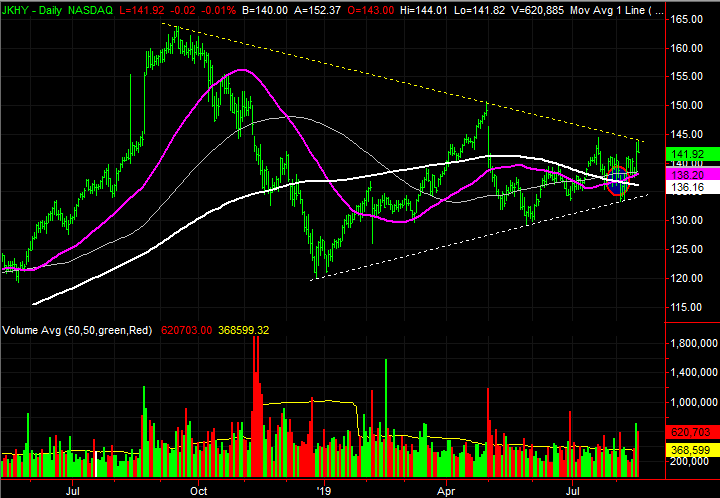
Jack Henry & Associates was one of the few names that was unable to make forward progress on Friday, pulling back just a bit after soaring earlier in the week.
Still, there’s much to like about the circumstances JKHY stock has made for itself over the course of the past several weeks. And, just within the past few days the scales have started to lean in a bullish direction again. The trick will be clearing one more hurdle that was verified with Friday’s high.
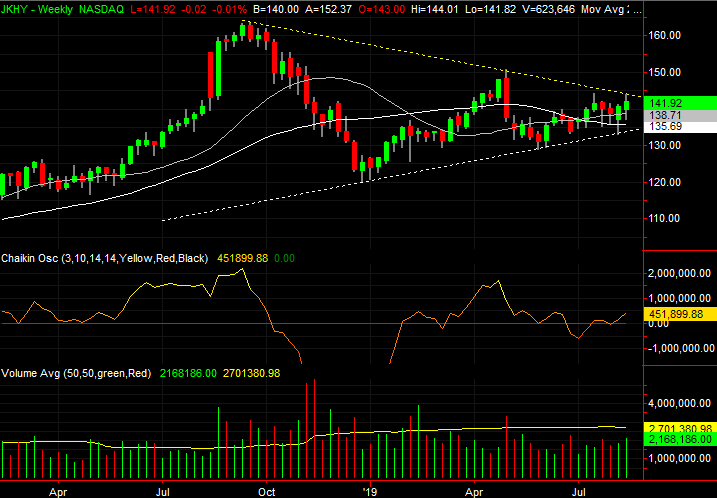
That last hurdle is the upper boundary of a converging wedge pattern that has been forming since September of last year, plotted in yellow on both stock charts.
Although tests of the wedge’s upper boundary have failed before, this one’s starting out with an advantage. This time, the test is coming after the purple 50-day moving average line has moved above the white 200-day line.
It’s confirmed by the Chaikin line’s move above the zero level on the weekly chart, though even just a visual inspection of the same chart shows bullish volume has grown in just the past couple of weeks.
Activision Blizzard (ATVI)
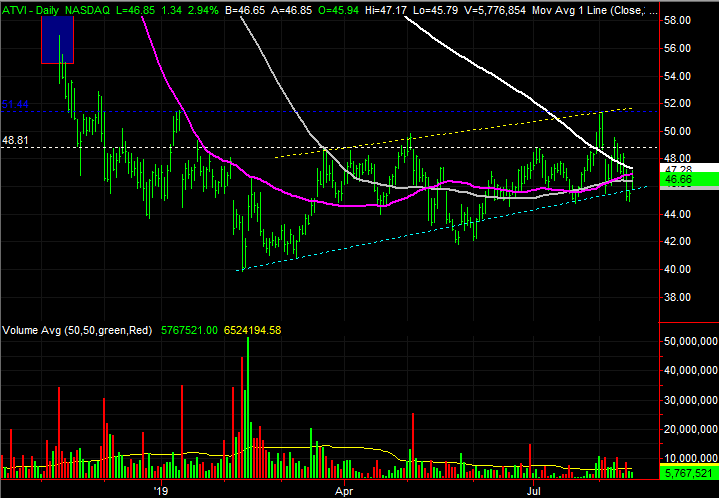
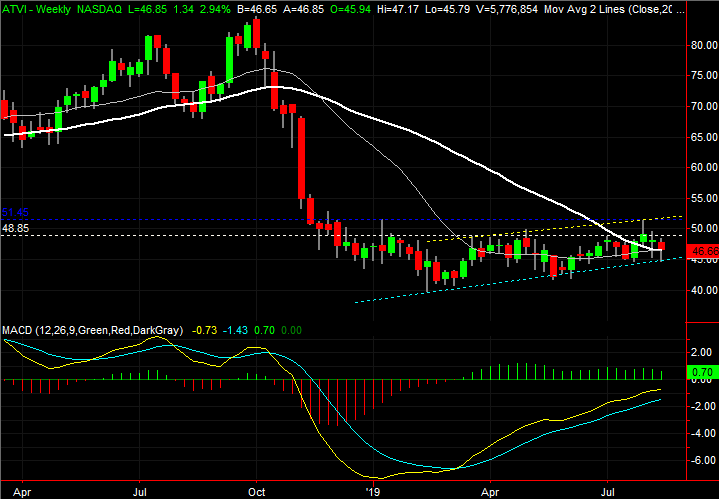
Finally, the last time we took a look at Activision Blizzard back on July 29, it was working on breaking above its 200-day moving average line. It was a good effort too. A long streak of higher lows and a narrow trading range were coiling the spring tight, setting up a prolonged move.
That’s what ended up happening later in the month. But, it didn’t last. The effort was up-ended a couple of days later. Nevertheless, the bulls are taking another shot, and this one looks even better positioned than the last.
What we’re seeing now and we didn’t see before is a better-defined streak of higher highs and higher lows, framed with yellow and light-blue lines — respectively — on both stock charts.
Simultaneously, we’re on the verge of seeing a so-called golden cross, where the purple 50-day moving average line crosses above the white 200-day moving average. It’s often a signal of more bullishness ahead.
Beyond that, a ceiling at $51.44 was confirmed that’s to the late-July peak. That’s also where shares topped in January. That level is plotted as a darker blue line on both stock charts.
As of this writing, James Brumley did not hold a position in any of the aforementioned securities. You can learn more about James at his site, jamesbrumley.com, or follow him on Twitter, at @jbrumley.
More From InvestorPlace
The post 3 Big Stock Charts for Monday: Amazon, Activision Blizzard and Jack Henry & Associates appeared first on InvestorPlace.
