3 Big Stock Charts for Thursday: Xilinx, Norfolk Southern and Iqvia Holdings
Wednesday’s gain may not have been enough to carry the S&P 500 index all the way back above its pivotal 50-day moving average line, but the 1.08% rally was enough to get stocks to within striking distance of that feat.

Source: Shutterstock
General Electric (NYSE:GE) did much of the heavy lifting, gaining more than 5% after Citigroup suggested its turnaround effort “could be more significant” than the market presently appreciates. Meanwhile, Roku (NASDAQ:ROKU) may have made less of an overall impact, but still logged a bigger gain by rallying nearly 8% after D.A. Davidson analyst Tom Forte upped his target to $185 — the highest on Wall Street.
Despite the rising tide, however, not every name was a winner. American Eagle Outfitters (NYSE:AEO) tumbled more than 11% after reporting same-store sales growth of 2%, versus the 6% analysts were modeling.
InvestorPlace - Stock Market News, Stock Advice & Trading Tips
As for names worth a closer look as we move into the home stretch of the short trading week, however, take a look at stock charts of Iqvia Holdings (NYSE:IQV), Xilinx (NASDAQ:XLNX) and Norfolk Southern (NYSE:NSC). Here’s why, and what may come next.
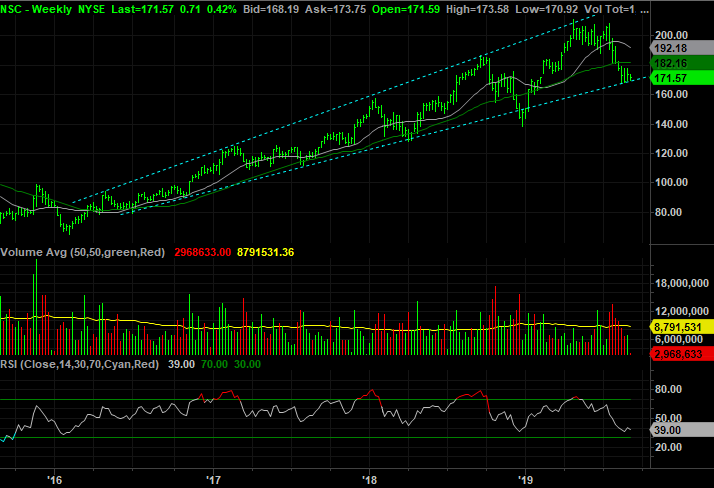
Norfolk Southern (NSC)

The past few weeks have been tough ones for railroad stocks. Norfolk Southern has been no exception.
Since the middle of last month, things have seemingly changed. NSC stock appears to have found support — or perhaps made support — before matters got too far out of hand. While there’s reason for optimism, there’s also reason for concern. One more slip-up from here could crack a couple of different key floors and send Norfolk shares off the rails.
One of those floors is $168.37, plotted in white on the daily chart. Shares have been unable and unwilling to move below that market since the middle of last month.
Zooming out to the weekly chart of NSC stock, it’s clear there’s another support line at work. The line that connects most, even if not all, the major lows since 2016 is once again being tested.
Should the two floors snap and let the bears continue on, there’s not much historical precedent for the next-best landing spot. The most-likely level is December’s bottom around $140.
Iqvia Holdings (IQV)

It’s been anything but a straight-line effort, but Iqvia Holdings has been a surprisingly rewarding name over the past several years. Buying on the dip has been a savvy strategy’ It still is.
To that end, though some could and would argue that the lull witnessed since late June technically qualifies as a dip since it was stopped at an established technical floor, that may not be the case at all. One stumble could easily break that support level and send IQV stock to a better-established support level. And, the subtle clues suggest that’s the more-likely outcome here.
The make-or-break level on the daily chart is $150.63, marked in white in the graph.
On the weekly chart, however, the floor of interest is different. The line that connects the key lows since late December, marked in yellow, is being tested.
Should either or both floor fail to keep Iqvia propped up, the next most=likely support level is near $120. That’s where the lower boundary of a trading range established in 2016 and 2017 lies, marked as a dashed blue line.
It’s been relatively uneven, but it’s difficult to say the daily chart’s volume bars aren’t more bearish than bullish. That is to say, the red lines are taller and more frequent than the green volume bars.

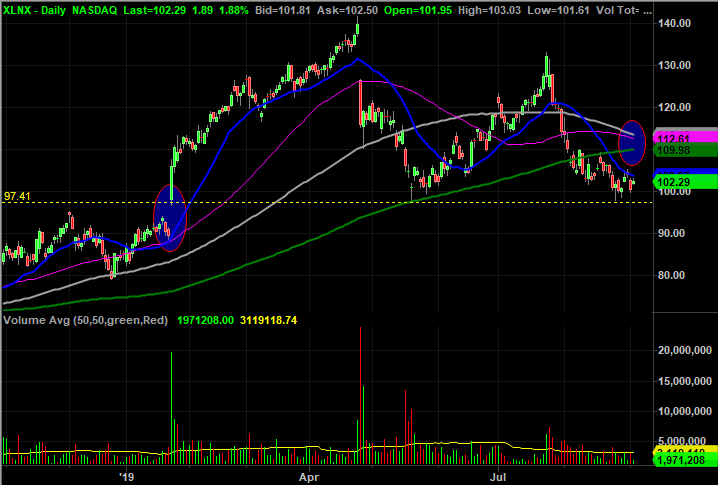
Xilinx (XLNX)

Finally, with just a quick glance, it seems Xilinx shares have sidestepped trouble. Finding the same floor they found in May, the pullback that started in late July has been halted as of last week.
A closer look at the chart of XLNX stock, however, reveals shares may not be as risk-free as first thought. The stock is finding resistance at a place it can’t afford to face resistance, and that could buy the bears just enough time to shore up their defensive line and force Xilinx to lose ground. One small stumble could get very big, very fast.
The support in question is right around $97.40, plotted as a yellow line on both stock charts. Notice that’s also the upper boundary of the gap left behind in January, begging to be closed now.
Not only would a move to fill in that gap possibly start a self-fueling selloff, it could lead the purple 50-day moving average line all the way below the green 200-day line. That’s a sell signal in and of itself.
The last bastion of hope in the event of should the support at $97.40 snap is the 61.8% Fibonacci line around $92.64.
As of this writing, James Brumley held no position in any of the aforementioned securities. You can learn more about James at his site, jamesbrumley.com, or follow him on Twitter, at @jbrumley.
More From InvestorPlace
The post 3 Big Stock Charts for Thursday: Xilinx, Norfolk Southern and Iqvia Holdings appeared first on InvestorPlace.
