3 Big Stock Charts for Thursday: Western Union, SYSCO and H & R Block
The market wasn’t sure what to make of the interest rate cut. Stocks spent the better part of the day just a bit in the red, but when thrown for a look by the Federal Reserve’s decision to lower rates to the tune of a quarter of a point, they slumped in a measurable way. By the time the closing bell rang though, the S&P 500 was back to just a hair better than a breakeven.

Source: Shutterstock
The broad market might have fared much better were it not for FedEx (NYSE:FDX). Shares of the delivery giant fell nearly 13% after falling short of last quarter’s earnings estimates and then dialing back its 2020 outlook. Chesapeake Energy (NYSE:CHK) was a major drag too though, sliding more than 10% lower as investors unwound their buying spurred earlier this week by news that an attack on oil fields in the Middle East posed a threat to global supply.
Among the winners that helped keep the S&P 500 out of the red was General Electric (NYSE:GE), albeit just barely. Shares of the beleaguered industrial giant mustered a little more than a breakeven on the heels of improving confidence in the company’s recovery prospects.
InvestorPlace - Stock Market News, Stock Advice & Trading Tips
As for stocks worth a closer inspection moving into today’s action, take a look at the stock charts of H & R Block (NYSE:HRB), SYSCO (NYSE:SYY) and The Western Union Company (NYSE:WU). Here’s why.
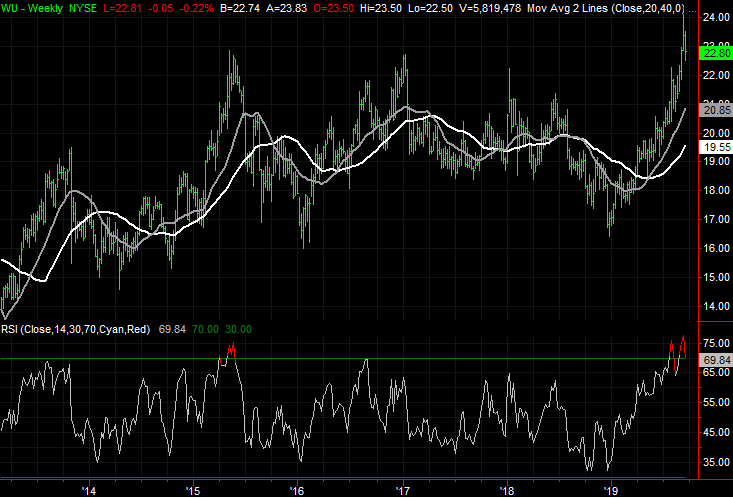
Western Union (WU)

Were it just the loss shares of The Western Union Company logged on Wednesday, the matter might be dismissible. In fact, it wouldn’t even be interesting to take note of.
Between the shape of yesterday’s intraday action though, and the context in which it happened, it’s difficult to ignore. While the bigger-picture uptrend is still completely intact, it’s nearing a breaking point, and is more vulnerable now than it has been at any point in the past several months.
Yesterday’s start was a firmly bullish one, but over the course of the day, that gain was turned into a decided loss. Such an intraday swing is concerning, even if it has not yet dragged WU below its blue 20-day moving average line.
The underpinnings for what’s quickly turning into a new downtrend, however, is the bar from Sept. 12 (highlighted). After a week and a half of gains leading up and into it, the open and close at the middle of that high/low range. This often occurs at pivot points, in this case out of an uptrend and into a downtrend.
It’s only evident on the weekly chart, but this month’s red-hot bullishness has pushed Western Union deep into overbought territory, according to the RSI indicator.
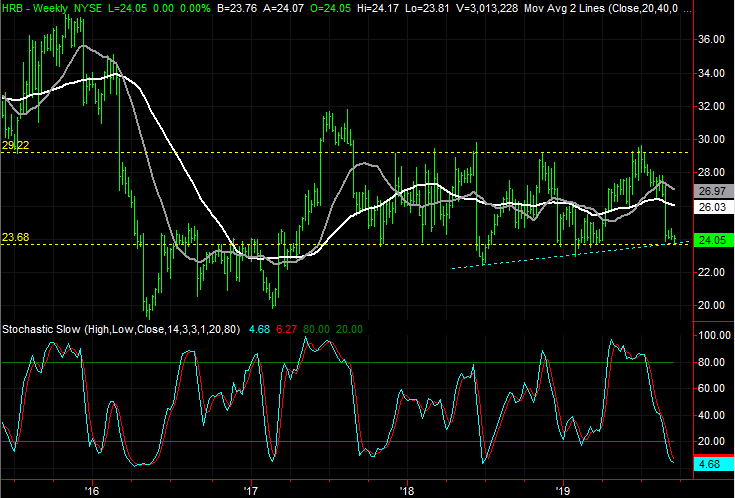
H & R Block (HRB)

Back in late June, H & R Block shares were knocking on the door of a huge technical ceiling. The stock had just pushed up and off of a horizontal floor, and though not yet above a key high, the momentum at the time suggested such a move was likely.
It never happened. In fact, HRB stock fell all the way back to near that familiar floor, where it’s still applying pressure. The risk of a breakdown still looms large, and another slightly different support level has since come into play.
The big trading range that has remained intact for nearly two years now is framed with yellow dashed lines on both stock charts, plotted between $24 and $29, give or take.
In the meantime, a new rising floor has materialized. Plotted in light blue on both stock charts, it connects all the key lows since June of last year, including yesterday’s low.
Although there’s bearish momentum in place here, we’ve seen that before to no avail. A bounce is just as possible given the situation. Either outcome could be tradeworthy though.
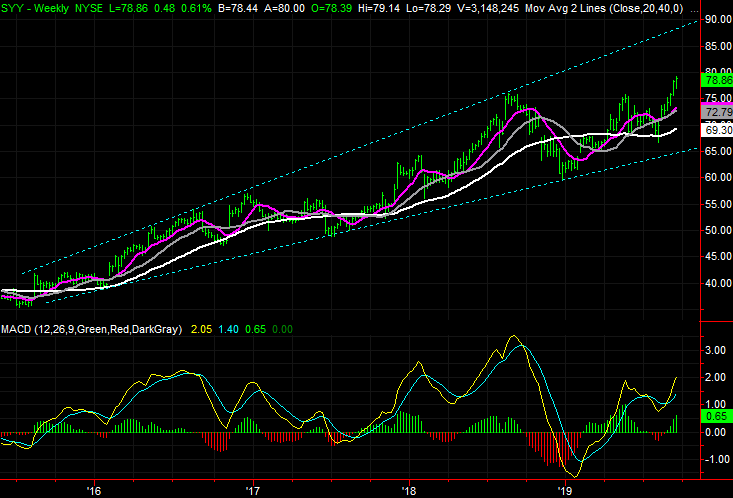
SYSCO (SYY)

Finally, a little more than two months ago, SYSCO was pegged as a good rally candidate. Although at the time it was stalling at the resistance dished out by the 50-day moving average line plotted in purple on both stock charts, the bigger-picture framework boded well.
That prospect has since panned out. Although it took a pretty good pullback and then quite a running start to get SYY shares over their hump, now that they are, there’s a ton of room to run.
That last look is marked with a yellow arrow on the daily chart. Shares technically moved above it, but had to come back and kiss the white 200-day moving average line to fully regroup.
This rebound effort is still all part of a much bigger trading range that put a new rally in motion late last year. The confines of this expanding wedge pattern are marked in blue dashed lines on the weekly chart.
The same weekly chart suggests SYY stock could climb to $90 or higher before major resistance is met. The broad market, of course, will have to help out for that to happen.
As of this writing, James Brumley did not hold a position in any of the aforementioned securities. You can learn more about him at his website jamesbrumley.com, or follow him on Twitter, at @jbrumley.
More From InvestorPlace
The post 3 Big Stock Charts for Thursday: Western Union, SYSCO and H & R Block appeared first on InvestorPlace.
