3 Big Stock Charts for Thursday: Western Union, Boston Scientific and Zions Bancorp
On Wednesday the bulls were largely in charge leading up to and even after the Federal Reserve ratcheted up interest rates by the expected quarter of a point. With a little time to think about it though, before the closing bell rang, doubt dragged the S&P 500 to a loss of 0.33%. The Nasdaq followed suit, closing down 0.21%.
Advanced Micro Devices (NASDAQ:AMD) arguably did most of the net damage, falling 1.2% for no particularly good reason other than the sheer weight of its recent, oversized gains at a point when investors are getting nervous. At the other end of the spectrum was the 4.5% advance from GoPro (NASDAQ:GPRO) in response to a big upgrade from Oppenheimer. But, it wasn’t infectious enough to get and keep enough other stocks in the black for the session.
Headed into Thursday’s trading action, stock charts of Western Union (NYSE:WU), Boston Scientific (NYSE:BSX) and Zions Bancorp (NASDAQ:ZION) are worthy of a closer look. Here’s what to look for.
InvestorPlace - Stock Market News, Stock Advice & Trading Tips
Western Union (WU)
Just because a stock managed to end Wednesday’s session in the black isn’t a reason in and of itself to buy it. On the other hand, it sure doesn’t hurt.
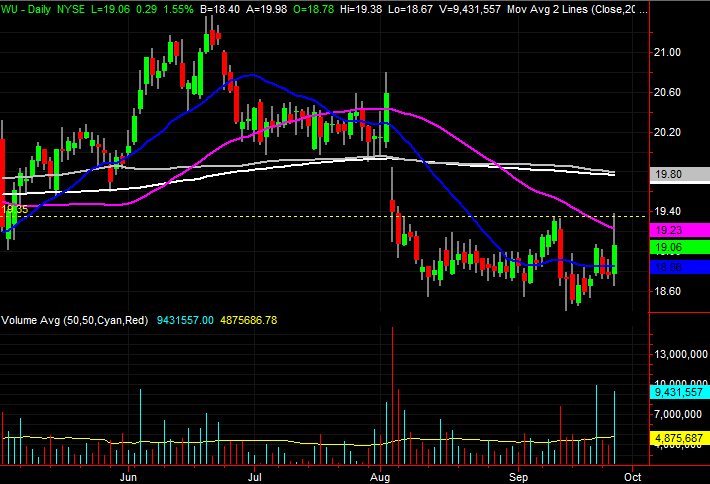
Either way, while Western Union still has some technical work to do to get over a critical hump, yesterday’s surge prompted by rumors that it was interested in selling its business payments unit may have fanned the flames of a bounce that was already underway.

• One has to zoom out to a weekly chart to see it, but the bulls have drawn a line in the sand around $18.40. Plotted with a red dashed line on the weekly chart, the stock only had to brush that area a couple of weeks ago to start testing the waters of a rebound.
• Zooming into the daily chart of WU, it’s not difficult to see there’s something about the $19.35 area. That was not only Wednesday’s high, but the peak from earlier this month as well. Still, even making the attempt is telling.
• The upside target isn’t crystal clear, but prior peaks ranging from $20.50 to $21.50 are the most plausible peaks, given the history in view.
Boston Scientific (BSX)
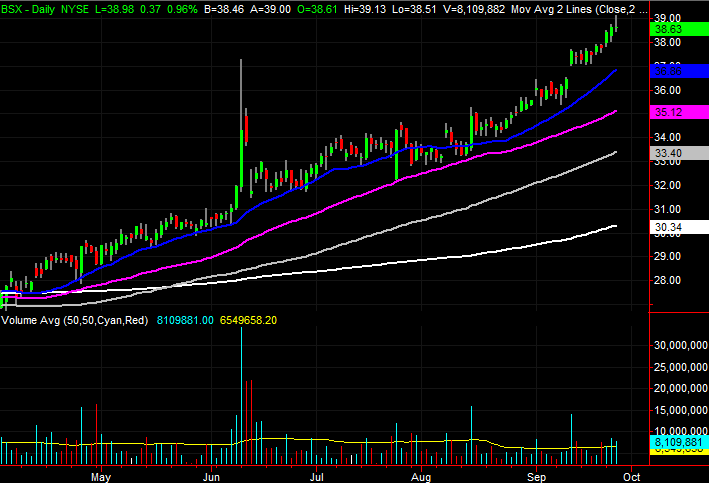
The 55% gain Boston Scientific shares have dished out since the end of last year is undeniably impressive. And, though it has often seemed like it was past time for it to stop, it kept going.
Between its overbought condition, the shape and placement of Wednesday’s bar and the broad market environment though, BSX may well be ready to suffer a sizeable wave of profit-taking.

• Wednesday’s bar is telling. Though the open and close were both a bit better than Tuesday’s last trade, both were also well below yesterday’s peak of $39.13. The buyers were backing out before the closing bell rang, perhaps nervous of how overextended the stock has become.
• As of Wednesdays close, Boston Scientific shares are a whopping 27% above their white 200-day moving average line … a divergence that has not been sustained, as is evident with just a quick look at the longer-term weekly chart.
• Also evident on the weekly chart is the lack of volume behind the rally since April. Though it has not been a liability thus far, clearly not many traders are believers in the stock at any price above $30.
Zions Bancorp (ZION)

Finally, most bank stocks have been losing ground of late. The fact that Zions Bancorp is doing the same isn’t particularly remarkable.
On the other hand, ZION is unique in that with Wednesday’s 1.6% drop, it’s now with striking distance of a major support level. And, the deck is stacked against it.
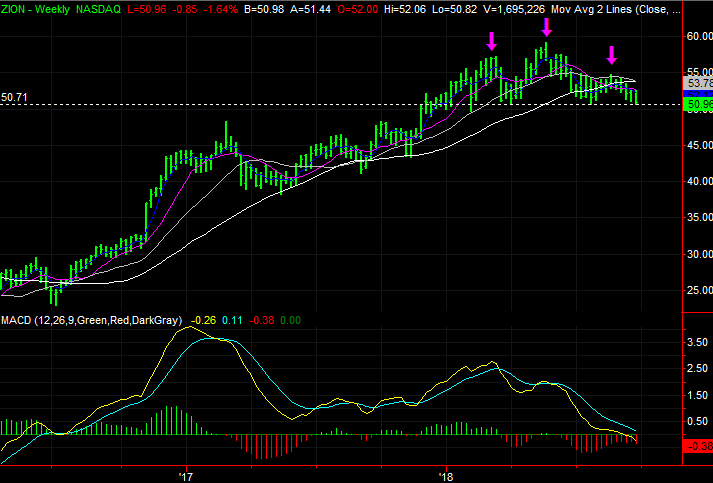
• The line in the sand is around $50.73, plotted with a white dashed line on both the weekly and the daily stock charts. That’s where Zions made a low several times since April, but there’s no major support anywhere below there.
• ZION is also testing that technical floor at a disadvantage. Within the past week, the stock had an opportunity to break above its blue 20-day moving average line as well as its purple 50-day moving average line, but both upended the rebound effort.
• Zooming out to the weekly chart we can see a hint of a head and shoulders pattern, with each of those three peaks marked with a pink arrow. It’s also on the weekly chart we can see that the failure of the white 200-day moving average line to keep the selling effort contained is a big deal.
As of this writing, James Brumley did not hold a position in any of the aforementioned securities. You can follow him on Twitter, at @jbrumley.
More From InvestorPlace
The post 3 Big Stock Charts for Thursday: Western Union, Boston Scientific and Zions Bancorp appeared first on InvestorPlace.
