3 Big Stock Charts for Thursday: Comcast Corporation, Duke Energy and Regions Financial Corp
Given Tuesday’s lack of bullish breadth and depth (it was actually net-bearish), Wednesday’s pullback wasn’t terribly surprising. But, wow! The S&P 500 stumbled 0.71%, led by tech giants Micron Technology (NASDAQ:MU) and Advanced Micro Devices (NASDAQ:AMD). It was American Airlines Group (NASDAQ:AAL) that took the biggest bite out of the market though. AAL shares fell more than 8% following lowered revenue guidance.
There were some winners, of course, but not nearly enough of the right ones to stave off a broad pullback.
Still, the market’s top trading prospects can and do lie on both sides of the fence. Those stock charts worth a closer inspection early Thursday are Duke Energy (NYSE:DUK), Comcast (NASDAQ:CMCSA) and Regions Financial (NYSE:RF). Here’s the deal.
InvestorPlace - Stock Market News, Stock Advice & Trading Tips
Comcast Corporation (CMCSA)
Ask ten Comcast Corporation investors whether or not they want the company to actually get into a bidding war with Walt Disney (NYSE:DIS) to acquire Twenty-First Century Fox (NASDAQ:FOXA), and you’ll likely get 10 different answers. Broadly speaking though, the changing shape of the chart says the market’s mostly glad it’s not likely Comcast is going to be lulled into overpaying.
There’s one more hurdle that needs to be cleared, however, before CMCSA is a risk worth taking.
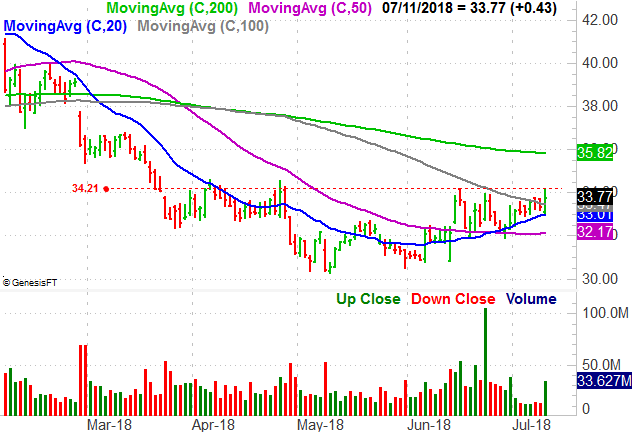
• That line in the sand is $34.21, which Comcast shares touched several times since March, and tested again with Wednesday’s high.
• For the past several days the 20-day moving average line has been supported — and guided higher — the stock leading up to Wednesday’s test of the technical ceiling.
• Keep in mind that news of a counteroffer for Fox from Comcast could change everything (again) in an instant. This is a prospect to keep on a short leash, if it becomes a trade.
Duke Energy (DUK)
Duke Energy, like most other utility names, started to peel back late last year and continued to wallow in that overstated weakness for most of the first half of this year. Rising interest rates, and the prospect of rate hikes for the foreseeable future, up-ended the dividend-centric industry.
Investors are starting to realize they may have overshot things with that pessimism though. Most utility stock charts, and DUK shares in particular, have started to recover nicely. They arguably proved the rebound is the real deal just this week.
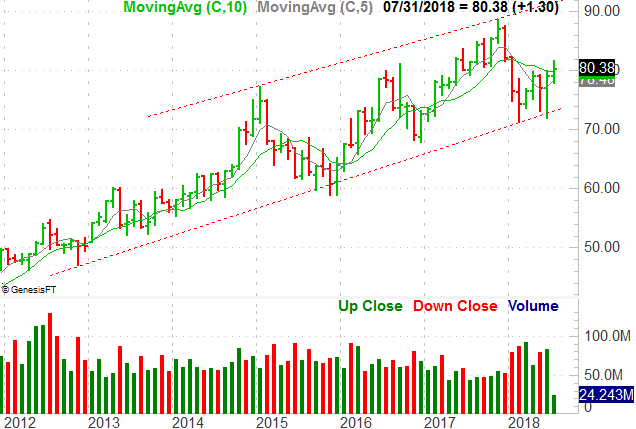
• The monthly chart’s ascension is framed by rising support and resistance lines. The rally underway right now was prompted by a push up and off that line.
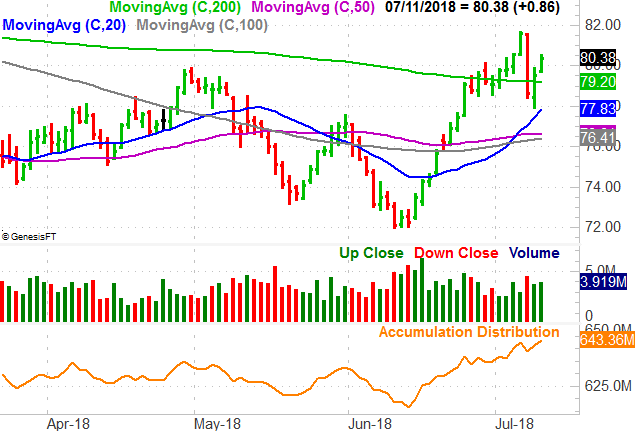
• The rally was going well until Monday, when the stock got clobbered. It was the biggest one-day like from Duke Energy shares we’ve seen in month, and could have easily spooked traders out of the stock for the foreseeable future. That facet that the strong selloff was reversed so decisively the next day and that we saw bullish follow-through on Wednesday says the bears just blew their best shot at tipping the scales in their direction.
• A close look at the daily chart makes it clear that the uptrend has been backed by plenty of volume … much more volume than was seen during its pullbacks. This is a clue that the market’s been “bigger picture” bullish on DUK and other utility names for a while now, bolstering the new bullish case.
Regions Financial (RF)

Last but not least, if you’ve taken Regions Financial off your watchlist since our look at its budding downtrend last Friday, put it back on. Though it ended up not immediately following through with that downside move, it’s knocking on that door again.
The bears may have better luck the second time around, and there are still several months’ worth of sideways action to offset with a volatile move.
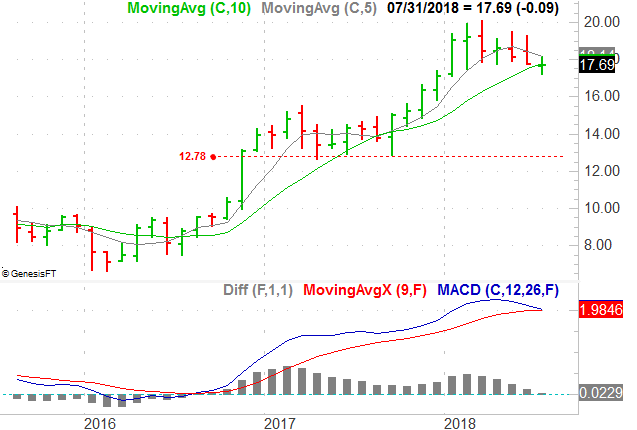
• The make-or-break line in the sand is still $17.74, where the stock found support a few times since earlier this year. That’s also where the 200-day moving average line is now.
• The volume behind the selling effort thus far has been significant, as evidenced by the falling Chaikin line. This weakness likely represents majority opinion.
• We’re near a bearish MACD cross on the monthly chart. On that chart we can also recognize the next-nearest technical support level is $12.78. Though a trip back to that value seems unlikely, it can’t be ruled out.
As of this writing, James Brumley did not hold a position in any of the aforementioned securities. You can follow him on Twitter, at @jbrumley.
Legendary Investor Louis Navellier’s Trading Breakthrough
Discovered almost by accident, Louis Navellier’s incredible trading breakthrough has delivered 148 double- and triple-digit winners over the past 5 years — including a stunning 487% win in just 10 months.
Learn to use this formula and you can start turning every $10,000 invested into as much as $58,700.
Click here to review Louis’ urgent presentation.
More From InvestorPlace
The post 3 Big Stock Charts for Thursday: Comcast Corporation, Duke Energy and Regions Financial Corp appeared first on InvestorPlace.
