3 Big Stock Charts for Thursday: McDonald’s, AbbVie and Coca-Cola
It was touch and go for the market for the better part of Wednesday, though by the time the closing bell rang, stocks managed to (mostly) ended the day with a gain. The Nasdaq finished yesterday’s action a hair in the red, while the S&P 500 edged 0.22% higher.
There were no real standouts amongst the lethargic action. American Express Company (NYSE:AXP) was arguably the day’s biggest story, with shares up 1.8% headed into its post-close earnings report, though fell 2.7% after hours when revenue fell short of estimates. International Business Machines (NYSE:IBM) took a different path. Though it ticked a little higher during normal trading hours, it jumped more than 3% in after-hours action in response to its earnings and revenue beat for the recently-completed quarter.
The opposing moves are a clear reminder that in this current market environment, traders must be willing to trade in both directions.
InvestorPlace - Stock Market News, Stock Advice & Trading Tips
To that end, Coca-Cola (NYSE:KO), AbbVie (NYSE:ABBV) and McDonald’s (NYSE:MCD) are lining up as Thursday’s top prospects. Between the three newcomers would have exposure to both sides of the market. Here’s what to watch with each.
Coca-Cola (KO)

Though Coca-Cola has struggled to adapt to an increasingly-health-conscious consumer, the fact of the matter is, it remains one of the market’s most reliable names, dishing out steady (even if uneven) forward progress for the past several years. The trick has been finding the optimal entry point into that long-term uptrend.
That window of opportunity may well be open right now.

• The long-term uptrend is framed by rising support and resistance lines on the monthly chart. We just pushed up and off of the lower edge of the channel, and have plenty of room to keep rising until the upper boundary is met. It’s near $49.30, but rising quickly.
• The February-May pullback was daunting, but not only has the stock rebounded since then, it’s cleared some major hurdles that confirm it’s in an uptrend. Namely, after testing it a few times as resistance last month, KO shares cleared the 200-day moving average line (green), and in the meantime have pushed forward to multi-week highs.
• Just this week we’ve seen the 20-day line moving above the 200-day moving average line and the 50-day moving average line has crossed above the 100-day line, confirming the undertow is turned bullish in multiple timeframes again.
AbbVie (ABBV)

With just a quick glance AbbVie shares just look like they’re bouncing around, without much direction.
Take a closer look at the chart though … the daily chart in particular. There’s some method to the bearish madness though, which is a concern — the bears are thinking this through, taking turns for the worst when and where the stock’s the most vulnerable.
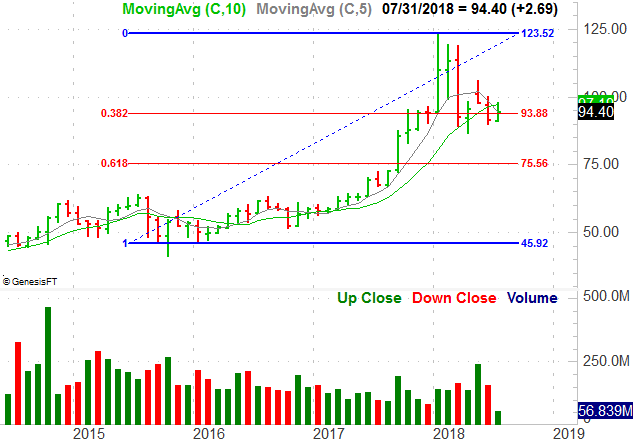
• AbbVie’s best shot at a rebound was a couple of weeks ago, when the 50-day and 200-day moving average lines were approached from underneath. All it took was a kiss of those two key moving averages to put the stock back into a downtrend.
• Although “just barely,” there has been more bearish volume than bullish volume, as evidenced by the persistently falling accumulation-distribution line.
• Should the 20-day moving average line (blue) fail to hold up as support, the next downside target is last month’s low near $90. Below that, the 61.8% Fibonacci retracement line at $75.56 is the next plausible floor.
McDonald’s (MCD)

This year is the worst year McDonald’s shares have dished out since 2012. The fast food chain hasn’t performed terribly, but it’s struggled. The weak performance from the stock can’t come as a complete surprise.
Yesterday’s slide, more important, does indeed signal that things could get much worse before they get any better, as most pros have been saying. One outlook is calling for 18% more downside, and there’s nothing about the chart’s shape to suggest such a move isn’t more than plausible.
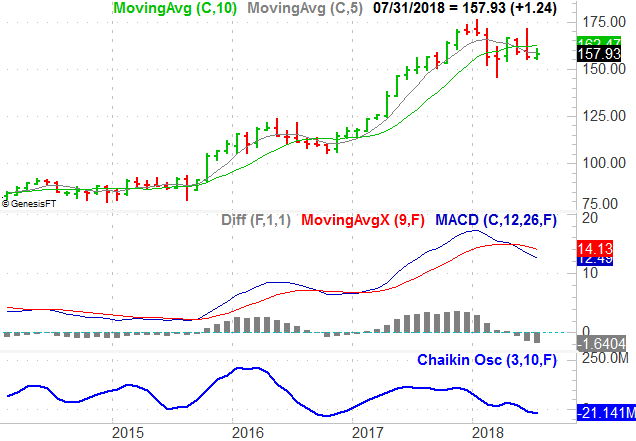
• The wide divergence of all the key moving average liens seen through January was rapidly undone beginning in March. In fact, those same four lines were almost all at the same point in late May. Knowing that periods of high volatility are followed by periods of low volatility and vice versa, that convergence should lead into a new divergence. In fact, it already is.
• That divergence thus far has been a bearish one, by virtue of the fact that the stocks below all of them, and we’re seeing bearish crossunders (of the shorter lines below the longer ones).
• The bearish undertones have been in place for a while now. The monthly chart’s MACD crossunder materialized in May, and its Chaikin line has been falling since late last year. The 2017 advance was never built to last.
As of this writing, James Brumley did not hold a position in any of the aforementioned securities. You can follow him on Twitter, at @jbrumley.
Legendary Investor Louis Navellier’s Trading Breakthrough
Discovered almost by accident, Louis Navellier’s incredible trading breakthrough has delivered 148 double- and triple-digit winners over the past 5 years — including a stunning 487% win in just 10 months.
Learn to use this formula and you can start turning every $10,000 invested into as much as $58,700.
Click here to review Louis’ urgent presentation.
More From InvestorPlace
The post 3 Big Stock Charts for Thursday: McDonald’s, AbbVie and Coca-Cola appeared first on InvestorPlace.
