3 Big Stock Charts for Tuesday: Western Digital, Huntington Bancshares and Boston Properties
Traders came back from the weekend in a much more optimistic mood than how they ended last week. The S&P 500 finished Monday’s action up 0.28%, led by Halliburton (NYSE:HAL) and Applied Materials (NASDAQ:AMAT)

Source: Shutterstock
Halliburton rallied more than 9% after the oil giant topped its second-quarter earnings estimates, and despite missing revenue expectations. Applied Materials advanced 6.1% in response to new bullishness from Goldman Sachs on the entire memory chip sector.
Weighing stocks down more than any other was the near-2% tumble from Verizon (NYSE:VZ). The telecom giant’s shares fell for no company-specific reason. Rather, telecom names in general, and their income orientation, has been falling out of favor for several days now.
InvestorPlace - Stock Market News, Stock Advice & Trading Tips
None of those names are interesting trading prospects headed into Tuesday’s action, however. Rather, it’s the stock charts of Western Digital (NASDAQ:WDC), Boston Properties (NYSE:BXP) and Huntington Bancshares (NASDAQ:HBAN) that merit the closest technical looks.
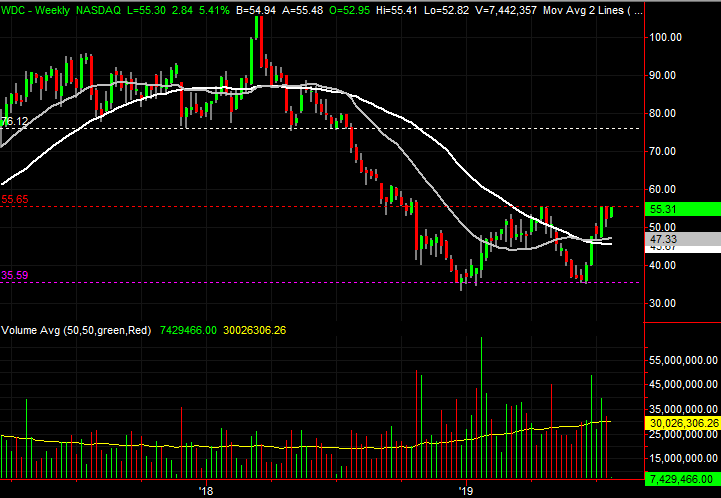
Western Digital (WDC)
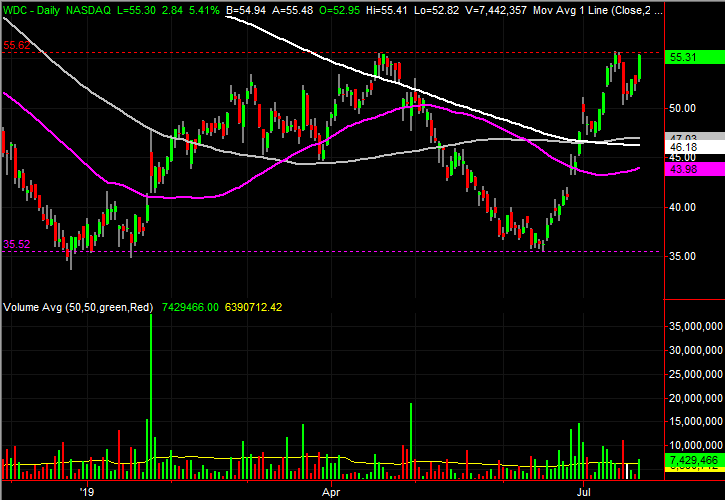
On April 17, Western Digital was pegged as a breakout candidate. A choppy but powerful rally managed to shove WDC stock out of a short-term trading range on major volume, simultaneously pushing the tech stock over its 200-day moving average line plotted in white on both stock charts.
The move faltered as quickly as it took shape, with Western Digital shares rolling over the next day and not looking back until the late-2018 low was revisited. Then, an even more powerful rally took shape again to wind up bumping into that very same April resistance. This time though, WDC stock has a good chance of following through.
The line in the sand is right around $55.70, where the stock peaked in April, in early July and then one more time yesterday.
Although we’ve seen this move before to no avail, this time, there’s persistent above-average volume behind the advance.
Although the momentum looks and feels healthy, Western Digital might need to pull back one more time before making the final thrust above $55.70. The key will be support at or near the 100-day and 200-day lines, marked in gray and white, respectively, on both stock charts.
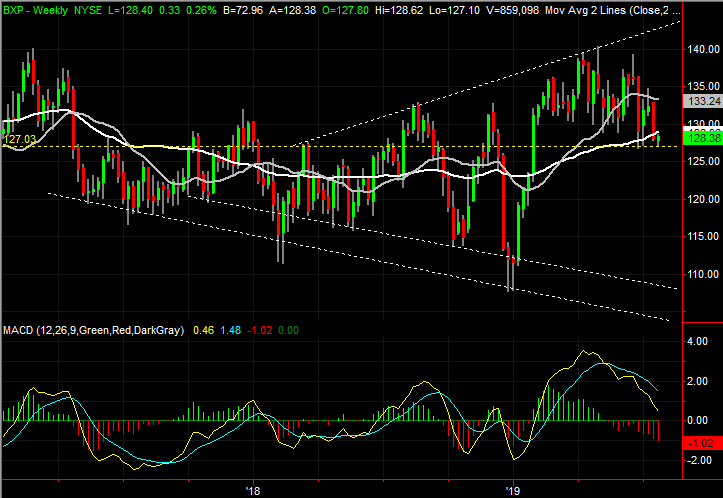
Boston Properties (BXP)

Far more often than not, a wedge-shaped pattern made by a stock or index chart squeezes that index or stock toward a tip of the wedge, building pressure the whole time. Once there’s no means of containing that pressure, it’s unleashed, pushing that underlying instrument higher or lower in a big way.
Boston Properties has dished out the opposite of that typical converging wedge pattern since early 2017, however. That is to say, the trading range has been expanding rather than narrowing. It’s not mattered yet, but as of Monday, BXP stock is dangerously close to breaking under a near-term support area that could drive shares considerably lower.
The last bastion of support in play for Boston Properties is the floor at $126.87, where it made a low in June, and where yesterday’s low was made. Notice the 200-day moving average line, plotted in white, is also under attack.
If that floor should end up failing to keep the stock propped up, a slide all the way back to the $100/105 area is possible. That’s where the lower boundary of the expanding wedge currently lies.
The odds are working against the bulls, and for the bears. Early this month, the stock tried to rebound, but met clear resistance at the purple 50-day line and grey 100-day moving average line (highlighted).
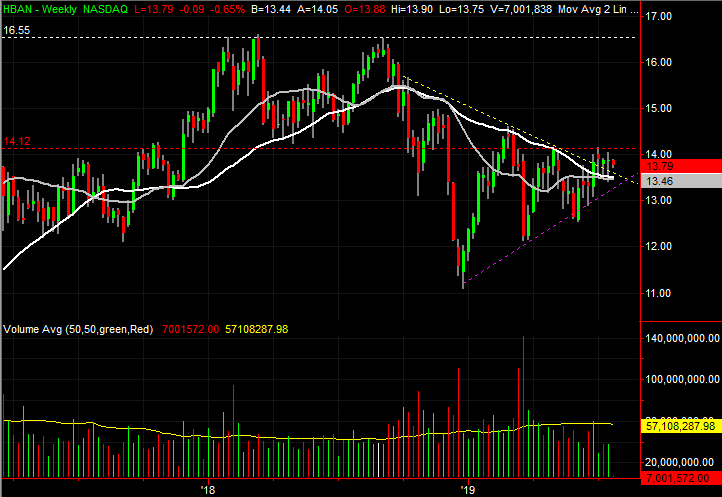
Huntington Bancshares (HBAN)

Late last month, Huntington Bancshares was making a third attempt to hurdle a well-established, falling resistance line that had been repeatedly augmented by the 200-day moving average line. The swell of bullish volume behind the effort at the time, however, made that particular move the most compelling yet.
HBAN ended up clearing the hurdle, but soon found another one. That is, the April/May high near $14 once again kept the bulls at bay. The buyers may have only needed to regroup though. The odds of a full-blown breakout thrust developing here continue to improve, even if Huntington Bancshares stock seems range-bound for the time being.
The ceiling to watch is just above $14, plotted with a red dashed line. HBAN has topped out there twice since April.
Although it ultimately failed to make a higher high, over the course of the past couple of weeks, the white 200-day moving average along with the gray 100-day line have served as a support level, letting the market regroup.
What’s missing thus far that wasn’t missing near the end of June is a healthy amount of volume to fuel a sustained breakout.
As of this writing, James Brumley did not hold a position in any of the aforementioned securities. You can learn more about James at his site, jamesbrumley.com, or follow him on Twitter, at @jbrumley.
More From InvestorPlace
The post 3 Big Stock Charts for Tuesday: Western Digital, Huntington Bancshares and Boston Properties appeared first on InvestorPlace.
