3 Big Stock Charts for Wednesday: A.O. Smith, Mastercard and Intercontinental Exchange
The impending reversal still hasn’t been confirmed or solidified, but Tuesday’s 1.57% gain from the S&P 500 is a pretty solid start. The volume behind the move was pretty good too. Now let’s see if the bulls can string two or three such days together.
Facebook (NASDAQ:FB) did a great deal of the heavy lifting, gaining 2.9% during market hours and then adding on another 4.8% in after-hours trading following the post-close release of its third quarter numbers.
There were losers too, like General Electric (NYSE:GE), which fell over 8% on news that it was paring its quarterly dividend back to only one cent per share. Advancers outnumbered decliners by more than two to one though, washing out the net damage the market’s losers were able to inflict.
InvestorPlace - Stock Market News, Stock Advice & Trading Tips
Still, most stocks are trading at extremes, up or down more than they might be in a less-tense trading environment. Traders would be wise to keep all positions on a short leash and look for setups that aren’t dependent on volatility or luck. To that end, the stock charts of Mastercard (NYSE:MA), Intercontinental Exchange (NYSE:ICE) and A.O. Smith (NYSE:AOS) are a trio of that small subset of names right now.
Mastercard (MA)

On Tuesday we took a close look at the daily and weekly stock charts of credit card middleman Visa (NYSE:V), pointing out how close it was to a break below a key moving average line that was under attack as a support level.
We could have just as easily substituted in rival Mastercard though, as the two have been moving in tandem. In fact, both names suffered the same damage today, and both are in trouble. We’ll switch our look over to the other one today.

• The make-or-break line was, on both stock charts, the 200-day moving average plotted in white. After a lackluster third-quarter print, MA stock broke below that level today for the first time since 2016.
• The weekly chart puts the profit-taking potential in perspective, but more important, the weekly chart shows where the most likely landing point is… the Fibonacci retracement line around $165. That’s near Mastercard found support a few times this spring.
• Notice how much selling volume has already materialized just this month. There are a lot of profit-takers waiting in the wings.
Intercontinental Exchange (ICE)
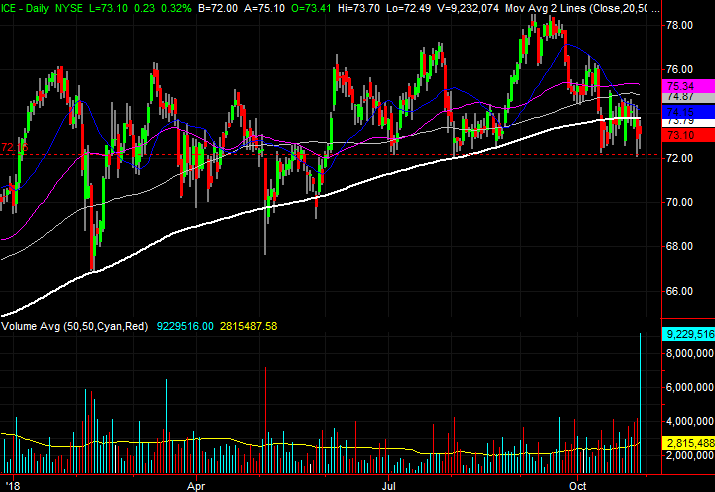
Intercontinental Exchange shares aren’t in trouble yet. In fact, they might be able to back away from the edge of a cliff and remain unscathed. But one more bad day could easily drag ICE below a huge horizontal support level. And, it has already spent a little too much time underneath another crucial floor.
• Once again, the 200-day moving average line is coming into play with Intercontinental Exchange. The stock broke below that level, marked in white on both charts, a couple of weeks ago, but unlike past breaks below the 200-day line ICE has pulled back below it this week.
• The horizontal support level to watch is $72, where Intercontinental Exchange has been finding support since the early July low. It’s plotted with a red dashed line.
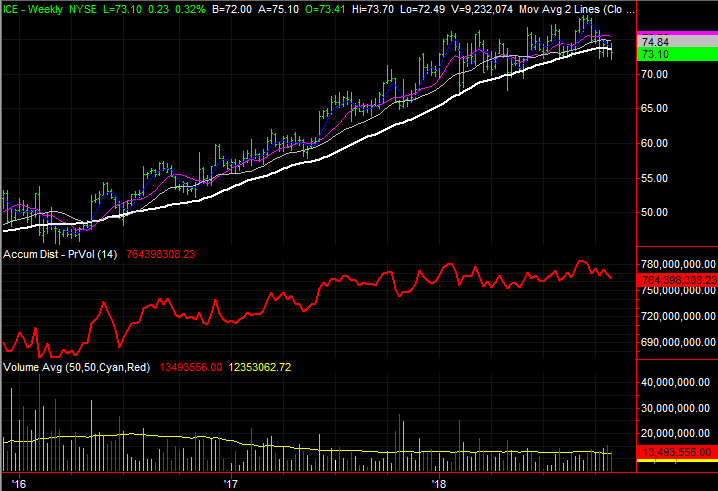
• Also like Mastercard, the weekly chart shows how this is the first time in months ICE has been below the 200-day average. It’s not clear how willing shareholders are to stick with it with this particular test.
A.O. Smith (AOS)
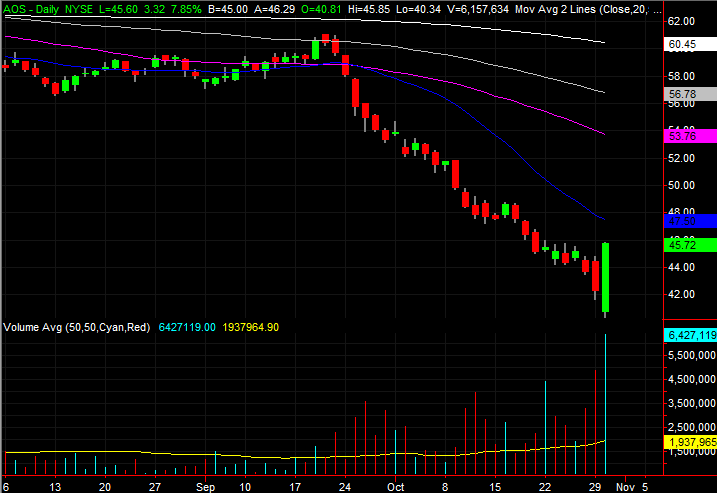
Finally, there were and still are some justifiable reasons A.O. Smith was sent lower since late September. On the other hand, down more than 30% at one point for the one-month stretch, it’s possible to say AOS is oversold and ripe for a rebound.
Tuesday’s third-quarter report appears to have been that catalyst.
• Tuesday’s bar is called a bullish outside day, marked by an open and close that completely engulfs Monday’s low-to-high range, and pointed in the opposite direction. This pattern often marks a pivot.
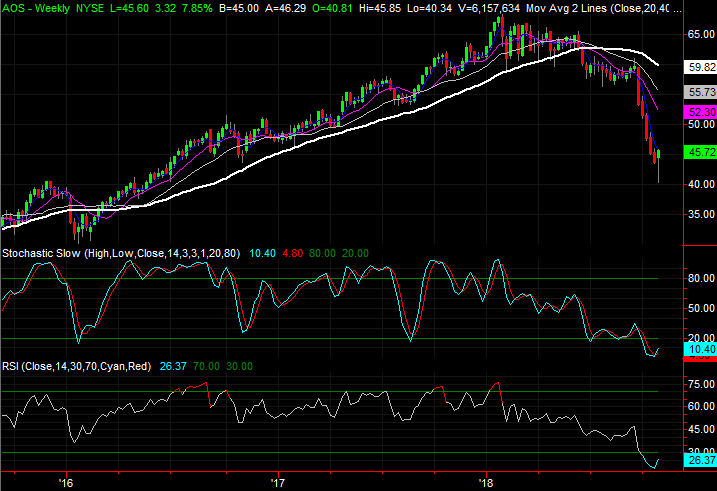
• Zooming out to a weekly chart, we can see that the stock has not been this oversold in years.
• All the same, though there’s room and reason for a rebound, this is a pattern that requires some sort of immediate follow-through. It also needs the market tide to chip in and supply a bullish undertow… at least to get started.
As of this writing, James Brumley did not hold a position in any of the aforementioned securities. You can follow him on Twitter, at @jbrumley.
More From InvestorPlace
The post 3 Big Stock Charts for Wednesday: A.O. Smith, Mastercard and Intercontinental Exchange appeared first on InvestorPlace.
