3 Big Stock Charts for Wednesday: United Technologies, Abbott Laboratories and Leggett & Platt
The market didn’t start Tuesday’s action on the best foot. But, some encouraging words from Federal Reserve Chairman Jerome Powell soothed investors’ worries, pushing stocks collectively back into the black by an average of 0.4%. Overstock.com (NASDAQ:OSTK) led the way with its 10%-plus gain, though beyond, noteworthy pacesetters were few and far between.
The market’s dead weight certainly wasn’t tough to find though. Netflix (NASDAQ:NFLX) ended the day down to the tune of 5% after it fell short of subscriber-growth outlooks for the recently ended quarter.
Everything else was… strangely tame.
InvestorPlace - Stock Market News, Stock Advice & Trading Tips
Still, a handful of stocks are setting up big moves even if they’ve yet to make them. Among the best of those best are Leggett & Platt (NYSE:LEG), Abbott Laboratories (NYSE:ABT) and United Technologies (NYSE:UTX). Here’s a closer look.
Leggett & Platt (LEG)
During the first quarter of the year, Leggett & Platt shareholders had good reason to be worried. The stock was into new 52-week low territory, and there was no end in sight.
Investors found some relief in June, though the rebound was still tentative. It became less tentative this month, thanks to a move above a key technical line. Since then the rebound effort has stalled, but it’s stalled in such a way that the bulls could be building up another thrust. That next bullish surge, however, could persist for a while because the stock’s already cleared all of its most meaningful resistance levels.
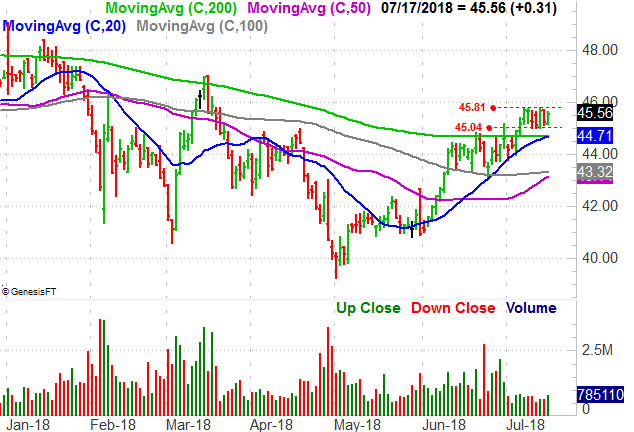
• The 200-day moving average line (green) was the ceiling in June, but that line was hurdled early this month thanks to support a couple of times at the 20-day moving average line (blue). As of Tuesday, the 20-day line is above the 200-day line, confirming at least the short-term trend is a bullish one.
• Since early last week, LEG has been trapped in a narrow, horizontal range between $45.04 and $45.81. The sideways action within this range serves as a buildup phase for the next bullish leg (though a break below $45.04 still can’t be ruled out).
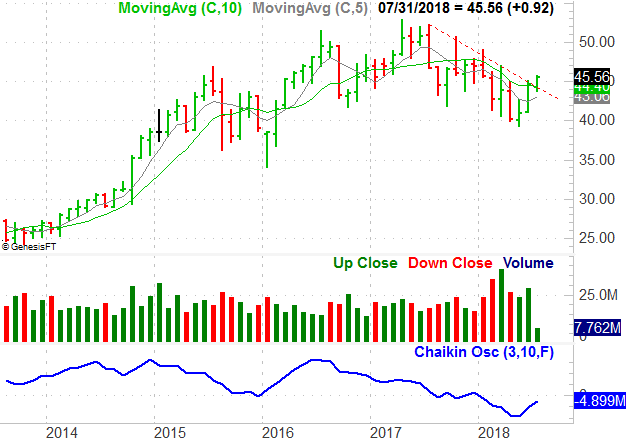
• The monthly chart indicates a long-standing descending resistance line has been snapped, and has done so with a healthy degree of bullish volume.
Abbott Laboratories (ABT)

The one thing more affirming than an unfettered streak of bullish momentum is a quelled effort to kill a rally. That’s what Abbott Laboratories shares were able to do on Tuesday, at the most opportune technical support. One more solidly bullish day could get ABT shares over a major hump.
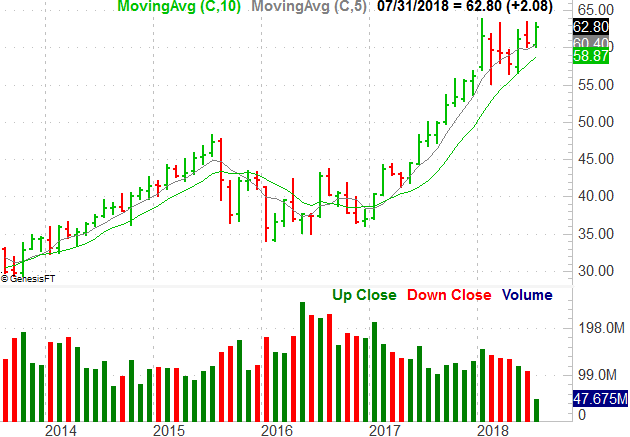
• Monday’s selloff was strong, threatening to jump-start a new wave of profit-taking. All it took was a kiss of the 20-day and 50-day moving average lines, however, to rekindle the bullish effort.
• The size/height of the Monday/Tuesday reversal is a decisive sign in and of itself, made decisively bullish by the fact that Tuesday’s volume was very high … suggesting a majority opinion.
• The line that tags all the major peaks since January is at $63.44. It’s been a ceiling that whole time, but a move above that technical resistance could create a technical reset of sorts and lead to a long-term move not unlike the one we saw in 2017.
United Technologies (UTX)

Though United Technologies shares have been in a respectable long-term uptrend that took shape in early 2016, the stock didn’t fare too well early this year. In fact, it fell all the way back to a major rising support line.
At the proverbial 11th hour though, the stock made a pivot. That was ugly too, but since then we’ve seen some key bullish clues take shape.
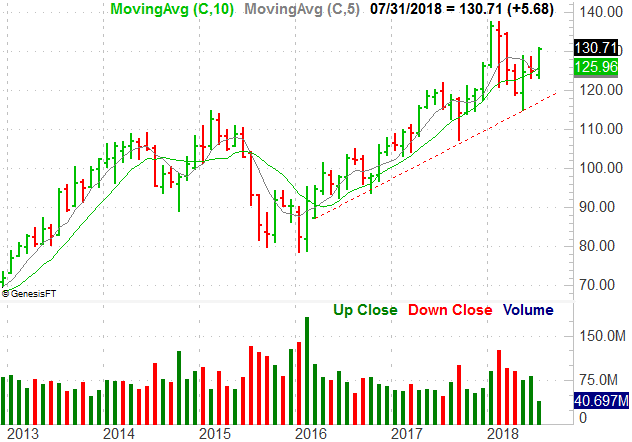
• The biggest of those clues is the way UTX shares found clean and consistent support at the 200-day moving average line in late June and early July. That line became a pushoff point last week.
• The convergence of all the key moving average lines also sets the stage for a divergence phase. Periods of high volatility are followed by periods of low volatility, and vice versa. The convergence of the major moving averages into a near-single point this month suggests we’ll start to see them move away from one another again. So far it seems that the divergence will be in a bullish direction.
• The growing degree of bullish volume underscores the notion that the divergence from here should be a bullish one. The accumulation-distribution line is not only rising, but appears to be accelerating higher.
As of this writing, James Brumley did not hold a position in any of the aforementioned securities. You can follow him on Twitter, at @jbrumley.
Legendary Investor Louis Navellier’s #1 Stock to Buy NOW
Louis Navellier — the investor the New York Times called an “icon” — just helped investors make 487% in the booming Chinese stock market … 408% in the medical device sector … 150% in Netflix … all in less than 2 years! Now, Louis is urging investors to get in on what may be the opportunity of a lifetime. By using a unique investment strategy called “The Master Key,” you could make hundreds of percent returns over the next few years. Click here to learn about the #1 stock recommendation from one of America’s top investors.
More From InvestorPlace
The post 3 Big Stock Charts for Wednesday: United Technologies, Abbott Laboratories and Leggett & Platt appeared first on InvestorPlace.
